If Even the Padres Are Reliant on the Homer, Where Can a Pitcher Hide?

Can the home-run spike be enjoyed equally across the game?
Some hitters are in better position to take advantage of what might be a juiced ball. Some environments, like Yankee Stadium II and Chase Field, are more favorable to fly balls from the hitter’s perspective. With home-run rates rising per fly ball (HR/FB) across the game, however, it seems at times as though no park is immune to the invasion of the long ball. It seems like we’re running out of pitching-friendly environments.
So that brings me to the curious case of the Padres.
The Padres lead the National League in percentage of runs scored via the home run (46.2%). They Padres would have not been my first guess, but I asked FanGraphs’ own Joe Douglas to research teams’ share of runs off home runs and this is what he found:
| Rank | Team | Total Home Runs | Total Runs Scored | % From HR |
|---|---|---|---|---|
| 1 | TOR | 112 | 356 | 52.0% |
| 2 | OAK | 123 | 376 | 50.3% |
| 3 | NYY | 128 | 465 | 48.6% |
| 4 | TEX | 130 | 429 | 48.5% |
| 5 | BAL | 116 | 370 | 48.1% |
| 6 | TB | 131 | 419 | 47.5% |
| 7 | SD | 99 | 305 | 46.2% |
| 8 | MIL | 133 | 434 | 46.1% |
| 9 | CHC | 112 | 388 | 44.9% |
| 10 | LAD | 121 | 449 | 44.8% |
| 11 | NYM | 126 | 399 | 44.4% |
| 12 | KC | 105 | 355 | 44.2% |
| 13 | WSH | 125 | 471 | 44.0% |
| 14 | CIN | 120 | 412 | 43.9% |
| 15 | HOU | 138 | 494 | 43.1% |
| 16 | DET | 104 | 402 | 42.3% |
| xxx | League | 3221 | 11966 | 42.0% |
| 17 | SEA | 98 | 417 | 40.8% |
| 18 | PHI | 81 | 321 | 39.9% |
| 19 | ARI | 111 | 439 | 39.9% |
| 20 | MIA | 98 | 389 | 39.3% |
| 21 | LAA | 92 | 372 | 39.3% |
| 22 | CWS | 97 | 388 | 39.2% |
| 23 | MIN | 99 | 388 | 38.9% |
| 24 | CLE | 100 | 403 | 38.7% |
| 25 | STL | 99 | 387 | 38.2% |
| 26 | COL | 98 | 435 | 35.2% |
| 27 | PIT | 83 | 359 | 34.5% |
| 28 | ATL | 83 | 383 | 34.5% |
| 29 | BOS | 87 | 420 | 32.4% |
| 30 | SF | 72 | 341 | 27.9% |
Now, the Padres are also last in runs scored (305) — in large part because of their league-worst .295 on-base percentage — so it’s not as though this penchant for the long ball has translated directly to offensive proficiency. But the club ranks second in fly-ball percentage (37%), trailing only the outlier Mets (43%), and is tied for third in GB/FB ratio (1.20). The Padres, despite their home, are hunting fly balls and homers and are having some success.
It’s somewhat curious that the Padres’ front office has built a team in such a manner. While their home, Petco Park, underwent changes it 2013, it remains one the majors’ most difficult parks in which to homer. It ranks as 20th-most favorable run-scoring park and 24th-most favorable home run park in the the game. The Padres rank eighth in the NL in HR/FB (13.8%).
They would seem to be at a disadvantage in this era since they don’t play in a hitter’s park, because they don’t have a single position player ranked in the top 50 of isolated power. The Padres entered the weekend with 46 home runs at home, which is below the MLB average of 54.
Yet, no team in the NL has depended more greatly on the homer for its runs, even if certain parties might like to see a greater diversity to the team’s attack.
“We are heavily reliant on the home run,” Padres manager Andy Green said. “I would prefer us to be less reliant on the home run.”
Part of the reason the Padres are reliant on the home run for scoring is (a) their lack of on-base skills and (b) the presence of legitimate power hitters like Wil Myers and Hunter Renfroe in their lineup. The Padres also rostered the most extreme fly-ball hitter in the game in Ryan Schimpf before he was optioned to Triple-A. His extended presence in the majors last season and this spring suggests the Padres are OK chasing fly balls and power.
“Ryan Schimpf has been a very effective player for us,” Green said. “You saw his launch angle go up even more this year, and there were a ton of infield fly balls. Him putting balls in play, yeah, we need more of that… We still love the walks; he’s doing that down in Triple. We still love the power that exists in him.”
So if the Padres are OK with launching air balls and chasing home runs, who isn’t looking to join the home-run surge? Green indicated he does not view his home park as a place that suppresses the fly ball. This is a drastic change from just several years ago.
“How the ball has changed, how it flies with the scoreboard and new buildings, it travels a little better than it used to,” Green said.
Does it?
Myers agreed with the assessment that Petco is no longer a pitcher’s haven, a place where a hitter might avoid elevating.
“I think of all the ballparks I’ve played in, it is as fair a ballpark as you will get,” Myers said, “When I came to San Diego, I heard it was a pitcher’s ballpark, but that was before they put the new scoreboard in and the other buildings were put in [beyond] the outfield. I’ve never hit a ball I thought was going out that didn’t… and I’ve hit a few balls that I didn’t know if they would go out that went out.”
To see if the ball is really traveling differently, I examined the average distance of fly balls hit with an 85 mph or greater exit velocity according to Statcast data, via Baseball Savant.
Petco Park average fly-ball distance:
2015 – 332 ft.
2016 – 337 ft.
2017 – 342 ft.
MLB average fly-ball distance:
2015 – 337 ft.
2016 – 340 ft.
2017 – 344 ft.
What’s interesting is that, according to the data, the average fly-ball studied is traveling 10 feet further in San Diego compared to two years ago, and better than the seven-foot increase at the MLB level.
The ball is traveling further at Petco. While the ball may be juiced, perhaps the new buildings surrounding Petco Park and the new scoreboard have changed the park’s microenvironment.
Conisder Petco Park in 2004:
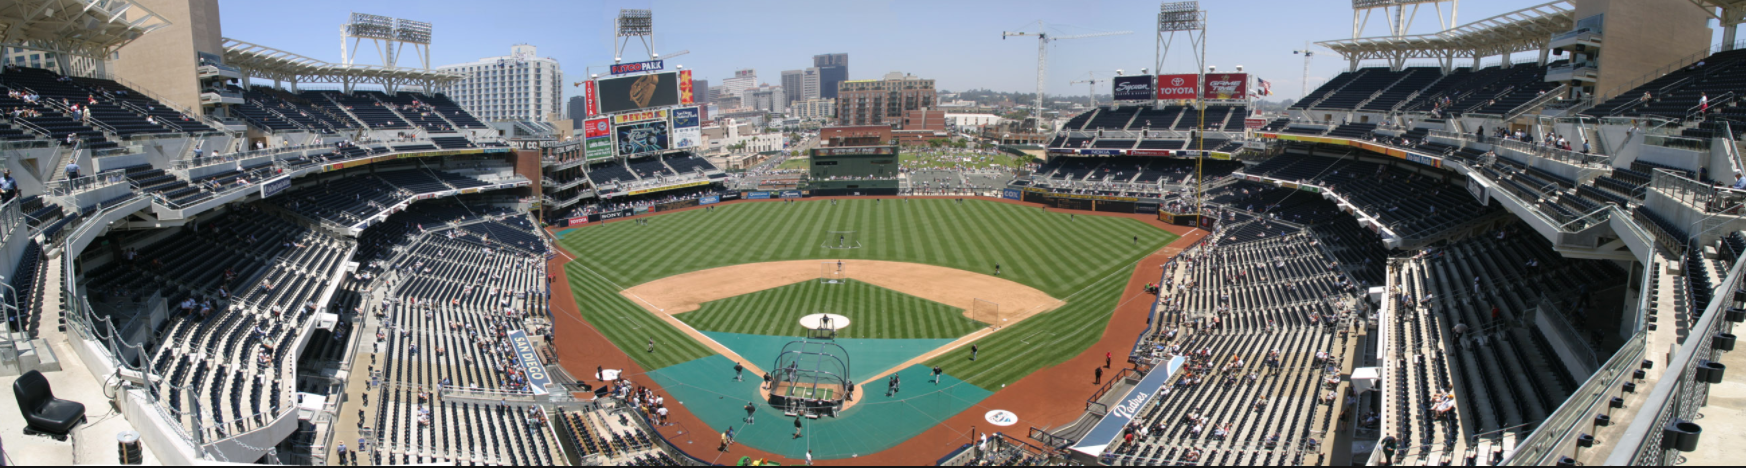
And in 2017:

As we can see, a significant number of high rises have sprouted beyond the outfield in the Gaslamp District.
And this is before even considering that the fences were brought in back in 2013.

Petco has changed so much, it’s now home to a club that scores a greater percentage of its runs via the homer than any other team in the NL.
With Citi Field bringing its fences in, with Comerica Park having brought its fences in long ago, with Kauffman Stadium having become shallower over the years, park environments are also increasingly working in favor of the home run. If the Padres are seeking the home-run and rostering extreme players like Schimpf, pitchers increasingly have few places to hide.
A Cleveland native, FanGraphs writer Travis Sawchik is the author of the New York Times bestselling book, Big Data Baseball. He also contributes to The Athletic Cleveland, and has written for the Pittsburgh Tribune-Review, among other outlets. Follow him on Twitter @Travis_Sawchik.
I know it is rhetorical but the answer is “San Francisco”.