
Bryce Harper in Graphs
Bryce Harper is having a career year emerging as one of baseball’s elite players. He leads all qualified batters in Major League Baseball in wins above replacement (WAR), weighted on-base average (wOBA), isolated power (ISO), and weighted runs created (wRC+). Harper has a wRC+ of 223, which means he’s created 2.23 times as many runs as the league average. wRC+ compares players to the rest of the league, because the stat is calculated relative to the league average.
I created a few interactive histograms to place a few of Harper’s stats in more context. For those who are not entirely familiar with histograms, they show the distribution of a particular stat. A narrow distribution has individuals clustered closer together, while a wide distribution has individuals that differ more. You might be familiar with the ubiquitous bell curve – the normal distribution. Histograms are important because they can provide a lot of information about the league quickly. While the wRC+ stat tells you how much better than league average the player is, it doesn’t tell you how many other players did as well.
The following is a Tableau interactive, which includes qualified batters across both leagues. There are two tabs: one for rate stats like wOBA, AVG, ISO, and BABIP and one for accrued stats like WAR, stats which have a different scale like wRC+, and I even put home runs (HR) in there as well. Harper is highlighted red where he falls within each histogram.
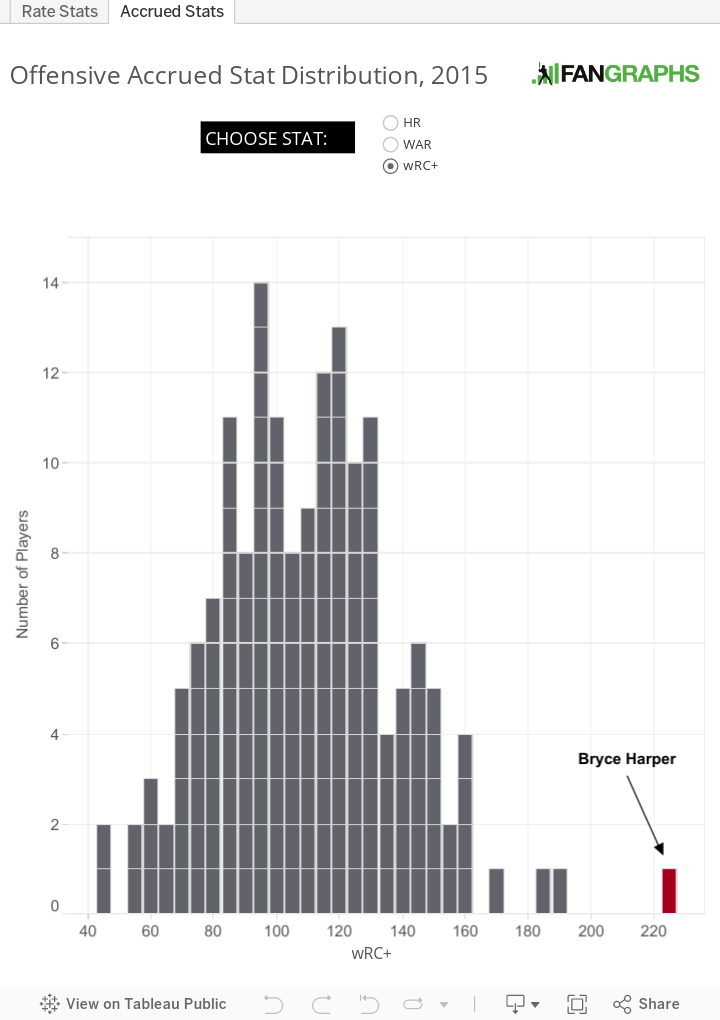
Data is limited to batters had enough at-bats to qualify for the batting title on 7/6/2015. All data is current to that date as well.
For most stats, Bryce Harper is quite the outlier – his stats are well beyond the rest of MLB. He has of wOBA of almost .500 and his ISO is higher than most players’ batting averages.
While Harper has been an outlier the first half of 2015, his career WAR through his age-22 season (2015) has been good, but he is still trailing Mike Trout by about 15 wins. Granted Harper still has to finish this season, but he is highly unlikely to get to Trout’s WAR totals.

EDIT: wRC+ is a relative rate stat. The post originally stated wRC+ was accrued. It remains on the visualization as such due to technical reasons.
I build things here.
#Harpergraphs
Isn’t wRC+ a rate stat?
Yes it is; I should have found a better name. I just needed to make the x-axis different in both graphs. Otherwise, I would have make no distinction.
It’s amazing, especially because the other end of the bell curve is Alexei Ramirez, but Harper has been much, much more good than Alexei has been bad. There’s no bad player in baseball this year whose badness can compare in epic scale to Harper’s awesomeness.
Yes, because it there were, he’d be out of a job before he could accumulate enough badness.
I’m sure there are plenty of them. They just get sent down to the minors or get very little playing time when they’re up.
or they’re on the Phillies infield.
or outfield
As an NL east non-Nationals fans, I am still struggling to come to grips with this explosion of baseball from Harper.
With that being said, wow look how great Mike Trout is, safely tucked away in the AL West.
I feel like every division has that guy, who is not only really good, but also kills his own division. As a Dodger fan, to me it is Paul Goldschmidt. I don’t particularly fear when the Dodgers play the Diamondbacks, but when Goldschmidt is up I get sweaty.
Holy fuck Bryce Harper.
Watching him play baseball really is my second rooting interest in sports.
Harper’s WRC+ compared to all seasons, all time is 7th. NBD
Bryce Harper’s WAR per 600 PA this season (10.4) is the second-best ever for a player 22 or younger, minimum of 100 PA, trailing only Ted Williams’ 10.9 WAR/600 in 1941.
The top ten:
Season Name WAR/600PA
1941 Ted Williams 10.9
2015 Bryce Harper 10.4
1917 Rogers Hornsby 9.7
2012 Mike Trout 9.7
2011 Brett Lawrie 9.1
2015 Carlos Correa 9.1
1909 Eddie Collins 9.1
1909 Ty Cobb 8.9
2013 Mike Trout 8.8
1911 Joe Jackson 8.7
Also, seeing Carlos Correa’s name next to Brett Lawrie’s is both impressive and tempering of my expectations for him.
That’s a weird list. Two groups of guys, separated by 100 years, with only Ted Williams in between.
I have a hunch that Trout will keep on doing his thing and end up with another 9 or 10-win season. 35-40 HR, 15-20 SB, pushing a 300/.400/.600 slash, plus defense in CF.
Harper has been ridiculous through the first part of the season, and it’s great to see him healthy and mashing. I could see him regressing a bit as pitchers really gameplan him in the second-half as to not let him beat them. To stay on this Bondsian pace at the plate, he’ll have to hit just as well as Bonds despite being pitched around/pitched differently. I still think he ends up in Trout territory after this season, eight to ten wins. Buuuuut. . . there is a chance that he just keeps rolling and pushes into historic territory, especially if his plate discipline, walk rate, contact ability, and selective power all stay strong. This should be a fun second half to watch from both Harper and Trout.
Pitchers have been bringing their best to Harper at bats since he entered the league. I think that is part of why it took him until this year to really put up these numbers. Keep in mind that while he was in the midst of being an simply good player last year he also was the only lefty to hit a HR off Kershaw and the only person since the invention of the closer to hit a home run off of a Kimbrel curve.
so remember how harper had that stupidly good may? .360/.495/.884 with a .561 wOBA and 268 wRC+?
barry bonds in all of 2001 hit .328/.515/.863 with a .537 wOBA and 235 wRC+.
of course, 2001 was an entirely different era, hence the somewhat less impressive adjusted numbers. but i always enjoy being reminded about how much barry bonds (and of course, ted williams and babe ruth) broke baseball.
On the other hand, on the single season wRC+ leaderboard for players not named Ted Williams, Barry Bonds, or Babe Ruth, Harper’s 2015 places 2nd, right behind Rogers Hornsby in 1924, and just a hair ahead of Mickey Mantle in 1957.
and a final interesting side note on eras, if harper continues his pace, he will be the only hitter ever to have scored a wRC+ above 200 with more strikeouts than walks. (’98 McGwire and ’94 Bagwell also struck out more than they drew unintentional walks, but McGwire drew more walks overall than strikeouts, and Bagwell was dead even).
Harper’s ISO is 100 points better than Trout’s (35pts better than any other player), who is 7th in baseball.