Is All Fair in Love and WAR?: The Importance of Hard-Hit Foul Balls


Apart from “outside,” the most frequent word to follow “just a bit” in the baseball lexicon is probably “foul.” How many times has your favorite hitter sliced one down the line, only for the first or third base umpire to frantically wave their hands and scream the dreaded four-letter f-word? (I mean “foul” — get your head out of the gutter.) Here’s a Kyle Schwarber example from the World Series:
The Phillies were inches away from avoiding just the second no-hitter in World Series history. Instead, Schwarber was punched out two pitches later. Unfortunately for Schwarber, this situation was all too familiar. Among the 419 hitters with at least 100 fouls in the 2022 regular season, he ranked fifth in foul barrel rate, coming in at 4.6%. That meant 18 total foul barrels; he would go on to strike out after seven of those.
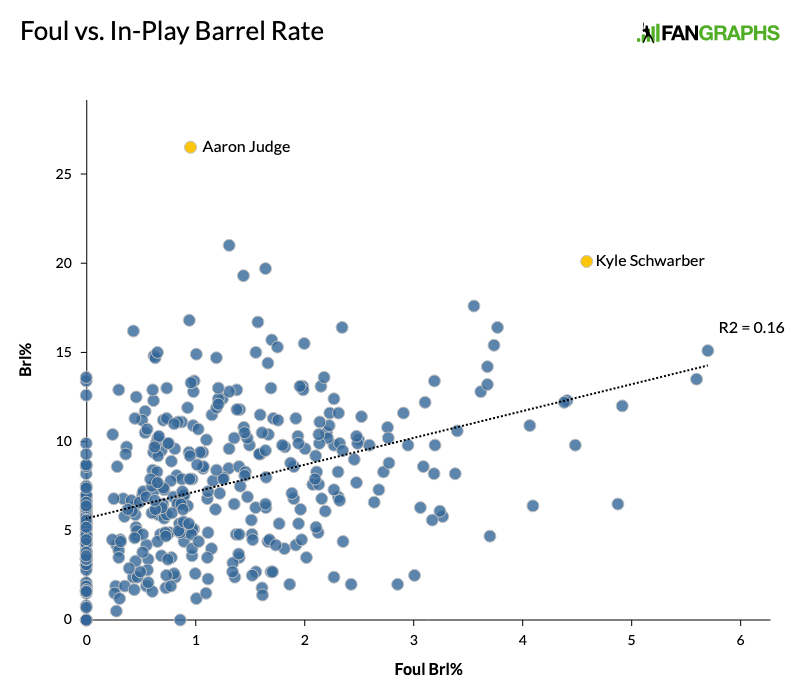
Should Schwarber change up his approach so he can hit more of those barrels fair? Well, among the 411 hitters with at least 100 balls in play in the 2022 regular season, Schwarber also ranked third in in-play barrel rate. Not to mention that he bashed 46 home runs; something was clearly working. On the whole though, most players with high in-play barrel rates also had relatively high foul-barrel rates (min. 100 fouls and 100 balls in play):
This goes for pitchers, too — those who yielded high rates of in-play barrels also tended to have higher foul-barrel rates (min. 100 fouls and 100 balls in play):

Fouls went for barrels less often than balls in play, hence the misalignment of the axes. This is probably because fouls are more often dribblers or mis-hits, as they represent at least something of a timing failure on the batter’s part. Along those lines, since the correspondence between in-play and foul barrel rates isn’t one-to-one, the difference between the two can be used as a way of evaluating a hitter’s timing or a pitcher’s timing disruption (or lack thereof). For example, Aaron Judge has a much higher in-play barrel rate than expected given his foul barrel rate; I take this as an indication that his timing was rarely off in general. Similarly, hitters’ timing was rarely off against Rony García and Yusei Kikuchi, but Freddy Peralta had a fairly high foul-barrel rate given his low in-play barrel rate, perhaps indicating that his location mistakes weren’t coming back to haunt him due to timing disruption even on those pitches.
Note that the correlation is smaller, though still statistically significant, for the pitchers. It’s possible that timing and contact-quality control are less intertwined in a pitcher’s skill set than a hitter’s. But that’s a topic for another day.
Especially since the in-game data isn’t quite there for it yet. A year and a half ago, Owen McGrattan looked at hard-hit fouls in the context of spray angle, analyzing a hitter’s pull-side power. Using his research as an inspiration, I hope we can eventually utilize foul ball spray angle to analyze pull-side power and timing. Unfortunately, as was the case when McGrattan published his piece, Statcast doesn’t currently provide enough information to calculate spray angle on the vast majority of fouls.
So instead, I’m going to be focusing on the second interesting piece of Schwarber’s World Series foul: the fact that he ended up striking out afterward. Schwarbs ultimately struck out 38.9% of the time after narrowly missing a hit on a foul barrel; overall, 32.3% of at-bats with at least one foul barrel and no mid-AB hitter or pitcher change (there were 1,377 such at-bats) ended in a K. Compare this mark to the 33.7% of at-bats with no barreled fouls, but at least one non-barreled foul (and no mid-AB hitter or pitcher changes; there were 72,866 such at-bats), that ended in Ks.
I used the latter as a comparison because there are more strikes on average following fouls, so I had to make sure the control ABs also contained fouls. If we want to be extra careful, we can ensure that there was only one foul (be it barreled or not) in each at-bat considered. Even in this case, strikeouts occurred less often after barreled fouls, as 29.0% of at-bats with a singular, barreled foul (there were 607) ended with the batter taking the long walk back to the dugout, while 32.3% of at-bats with a sole, non-barreled foul (there were 47,987) did.
Why might strikeouts follow barreled fouls less often? Well for one, as the first scatterplot above demonstrates, hitters who barrel fouls at high rates also typically barrel their balls in play at high rates; in other words, they’re usually more fearsome hitters, and they are more likely to be pitched around. But it’s possible they are also being pitched around because they just hit the snot out of a pitch, even if the batted ball in question landed out of play. To add yet another layer, what if there isn’t any pitching around at all, and the pitchers who give up more foul barrels are just more wild in general/don’t throw in the zone as much?
First, I moved to establish that there really are fewer pitches in the zone after foul barrels. Excluding counts with no strikes (since those never occurred after fouls) and based on average zone rate, I put each count into one of three categories: pitcher-friendly (0-1, 0-2, 1-2, 2-2), hitter-friendly (2-1 and 3-1), or even (1-1 and 3-2). Next, I compared zone rate for each of these count-categories across three conditions: immediately following a barreled foul, a non-barreled foul, or some other event (called strike, swinging strike, foul tip, ball). Here’s what I came up with:
| Foul Type | Hitter-Friendly | Pitcher-Friendly | Even |
|---|---|---|---|
| Barrel | 43.3 | 38.3 | 48.9 |
| Non-Barrel | 55.0 | 39.9 | 53.7 |
| Non-Foul | 56.9 | 41.5 | 51.0 |
Across all counts, the barreled-foul condition sees the lowest strike rate. There were only 67 barreled fouls followed by hitter counts, and the small sample size might explain why that cell is easily the lowest in its column. But barreled fouls also saw the lowest strike rate when they were followed by pitcher-friendly counts and even counts, with samples of 974 and 352 respectively.
That’s all well and good, but how do we know this wasn’t just because better hitters barrel more fouls and worse pitchers give up more barreled fouls? This was indeed the case, but foul-barrelers still performed better relative to expectations than non-barrelers:
| Foul Type | Batter wOBA | Pitcher wOBA | PA wOBA | n |
|---|---|---|---|---|
| Barrel | .320 | .310 | .296 | 513 |
| Non-Barrel | .314 | .304 | .278 | 38,335 |
Let’s split the difference and say that the expectation would be the average between the batter and pitcher wOBA for each condition. Incidentally, both conditions saw a 10-point batter-pitcher wOBA gap on average, which means that we should expect wOBAs five points lower than the batter’s wOBA for each condition: .315 for barrelers and .309 for non-barrelers. Barrelers underperformed by 19 points, notching a .296 wOBA, while non-barrelers underperformed by 31 points, putting up a .278 mark. Both were likely underperformances because there are more strikes on average following a foul.
Further, barrelers struck out at a 28.7% clip and walked at a 10.7% clip; the non-barrelers K’ed 31.7% of the time and walked in just 7.6% of their plate appearances. The 18-point difference in wOBA isn’t huge, but a good portion of it is likely due to the 6.1% improvement in K-BB%. This has little to do with pitcher zone rate: the average barreled foul was against a 49.0% zone-rate pitcher, while the average non-barreled foul was against a 48.9% zone-rate hurler. Barrelers did have slightly fewer strikes on average (0.72) prior to their fouls than non-barrelers (0.80), as well as more balls (1.04 to 0.89), but remember that barrelers saw fewer pitches in the zone after their fouls even when controlling for count; both prior- and post-foul pitches matter here.
At this point, it’s still hard to say definitively whether barreled fouls instill a sense of apprehension in the pitcher such that they begin to pitch around their foe. Another possible explanation for the wOBA and plate discipline gap between the two conditions in the table above is that hitters who barrel up a foul are probably already seeing the pitcher pretty well during the at-bat in question.
We can move to the hypothetical, though, and ask, if hurlers are really pitching around foul-barrelers, should they continue to do so? And once they’re being pitched around, should foul-barrelers continue to take their hacks? Probably — when the foul-barrelers put the ball in play, they hit it harder than their non-barrel-fouling counterparts:
| Foul Type | In-Play 50% EV | In-Play Brl% |
|---|---|---|
| Barrel | 92.4 | 8.9 |
| Non-Barrel | 90.6 | 6.5 |
Overall, this exercise has ended up more descriptive than prescriptive. Still, I had fun trying to quantify a small portion of the batter-pitcher mind game. I hope you had fun too — just don’t go around telling people that umps curse when they call a ball foul.
Alex is a FanGraphs contributor. His work has also appeared at Pinstripe Alley, Pitcher List, and Sports Info Solutions. He is especially interested in how and why players make decisions, something he struggles with in daily life. You can find him on Twitter @Mind_OverBatter.
I’ve always wondered if teams track exit velo on foul balls. A ball the lands just inside the line far is going to be used as a data point, so it would make sense that a ball that lands 4 inches to the left wouldn’t also be used as a data point.
Perhaps there’s value in looking at regression here too. If a player had a down year with a disproportionate amount of hard hit foul balls, that seems like a player I would bet on for positive regression