What Hard-Hit Foul Balls Might Tell Us
We’re now five years into the Statcast era, and with that has come a good base of knowledge and an understanding of what small sample events are significant or beyond noise. Alex Chamberlain recently provided a wonderful example of this type of analysis; I encourage you to read that to get a feel for what I’m going to be talking about. But where Alex and Connor Kurcon covered the values of hard-hit balls at extreme launch angles and extreme exit velocity at given pitch speeds, I want to cover foul balls and what we can — or maybe can’t — learn at the extremes.
Any quick look at the Statcast leaderboard will show you that Yermín Mercedes has a max exit velocity of 116.8 mph, good for ninth best in baseball this year. That’s an incredible feat for any player, but what criteria do we want to set when determining a max? We’re ultimately seeking to measure raw power output, so maybe we should be more inclusive to all batted ball events. If we include foul balls, Mercedes would suddenly have the sixth-highest max exit velocity in baseball at 117.7 mph.
I encourage you to listen to that clip with sound, because the play-by-play commentary is all we have as to where the ball landed.
That 0.9-mph jump might not mean much, but there’s more to it once you consider both the rarity of the batted ball and the fact that we have a number on it in the first place. There’s a wide acceptance of all stats derived solely from launch angle and exit velocity, but you should consider the importance of spray angle. In the same way that both Alex and Connor talked about abnormal exit velocities in the context of a pitch speed or launch angle, something similar should be noted when thinking about the spray of the ball.
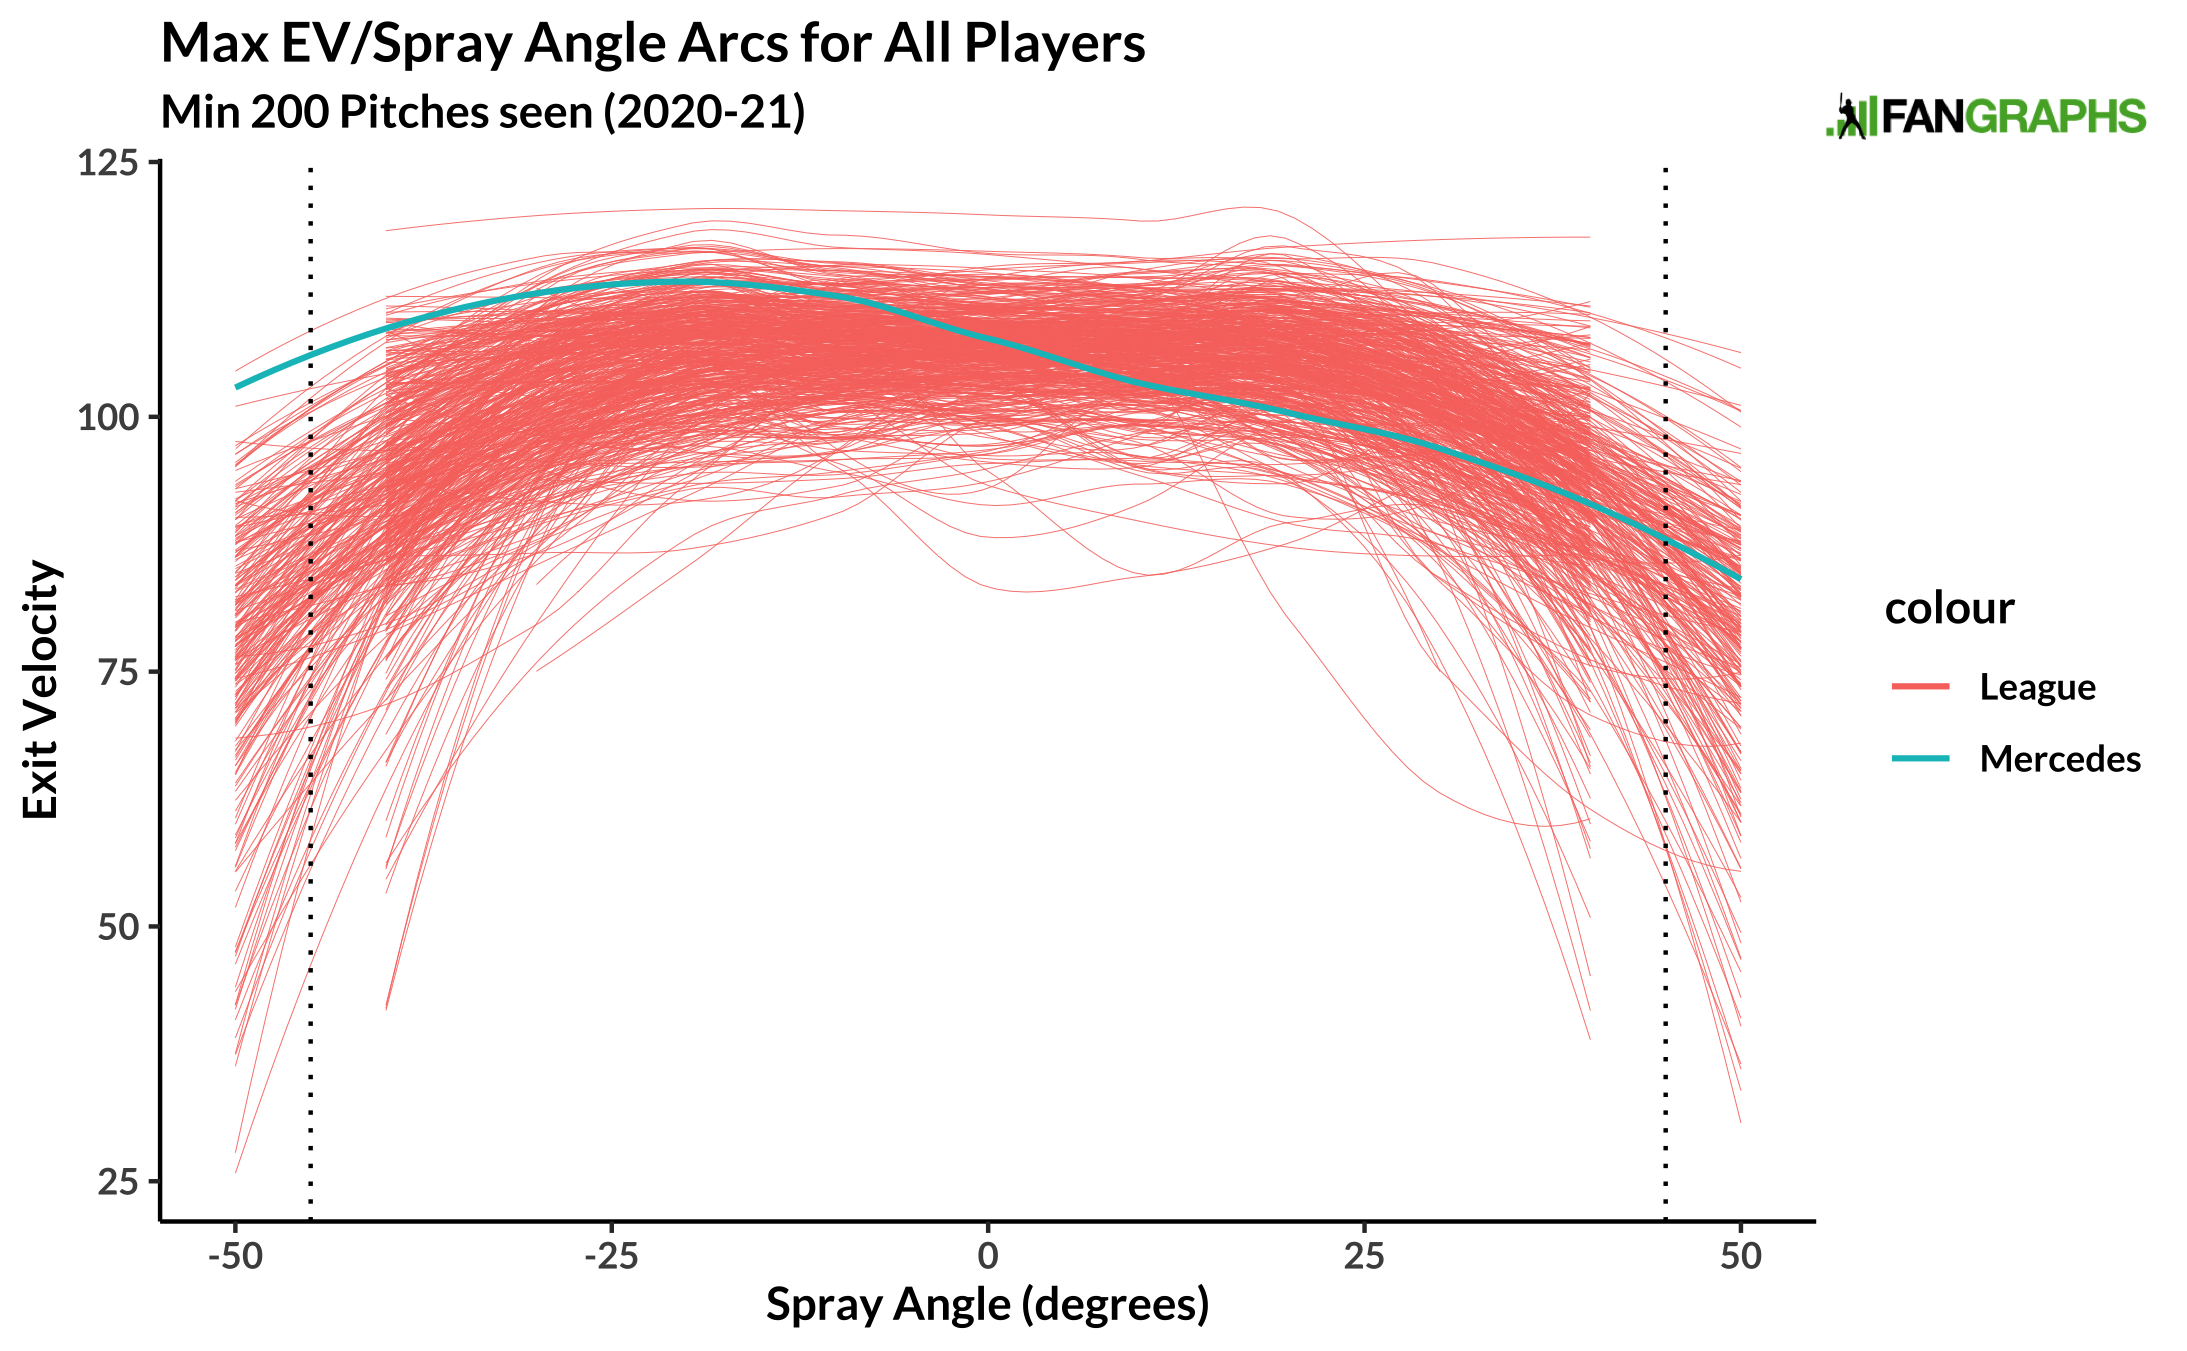
To understand this relationship, it’s important to see the spray angle at which each player generates their max EV:

With the foul lines at +/- 45 degrees, you can see that for most righties and lefties, the power is pull-side, closer to the poles. Nothing new there, but this look can be summed up more simply by tracking the max for all hitters at all spray angles and not dealing with any perceived averages.

There’s a clear tapering off toward the poles that can be attributed to the fact that bat speed should be decelerating that late into the arc of a swing. These shapes do show themselves to be largely telling for individual players, too; for our purposes, I’ll continue to pick on Mercedes.

Mercedes has top-of-the-line pull power, but it should be noted that his two hardest batted balls cannot be marked because we do not have their hit location coordinates. That would bump his pull-side shape of the curve even higher and with not much discernable drop-off as you push into foul territory.
Is that necessarily the best allocation of power? Maybe there’s a degree of naïveté in thinking a swing can be so malleable as to shift the shape of a max EV and spray angle arc to something more round across the whole field, but there is most certainly a lack in optimization when your hardest-hit balls in the air are out of play. We are missing too many hit locations on foul balls to do a more thorough analysis, but we can at least measure imbalance where one side of the field has significantly higher exit velocities than another.
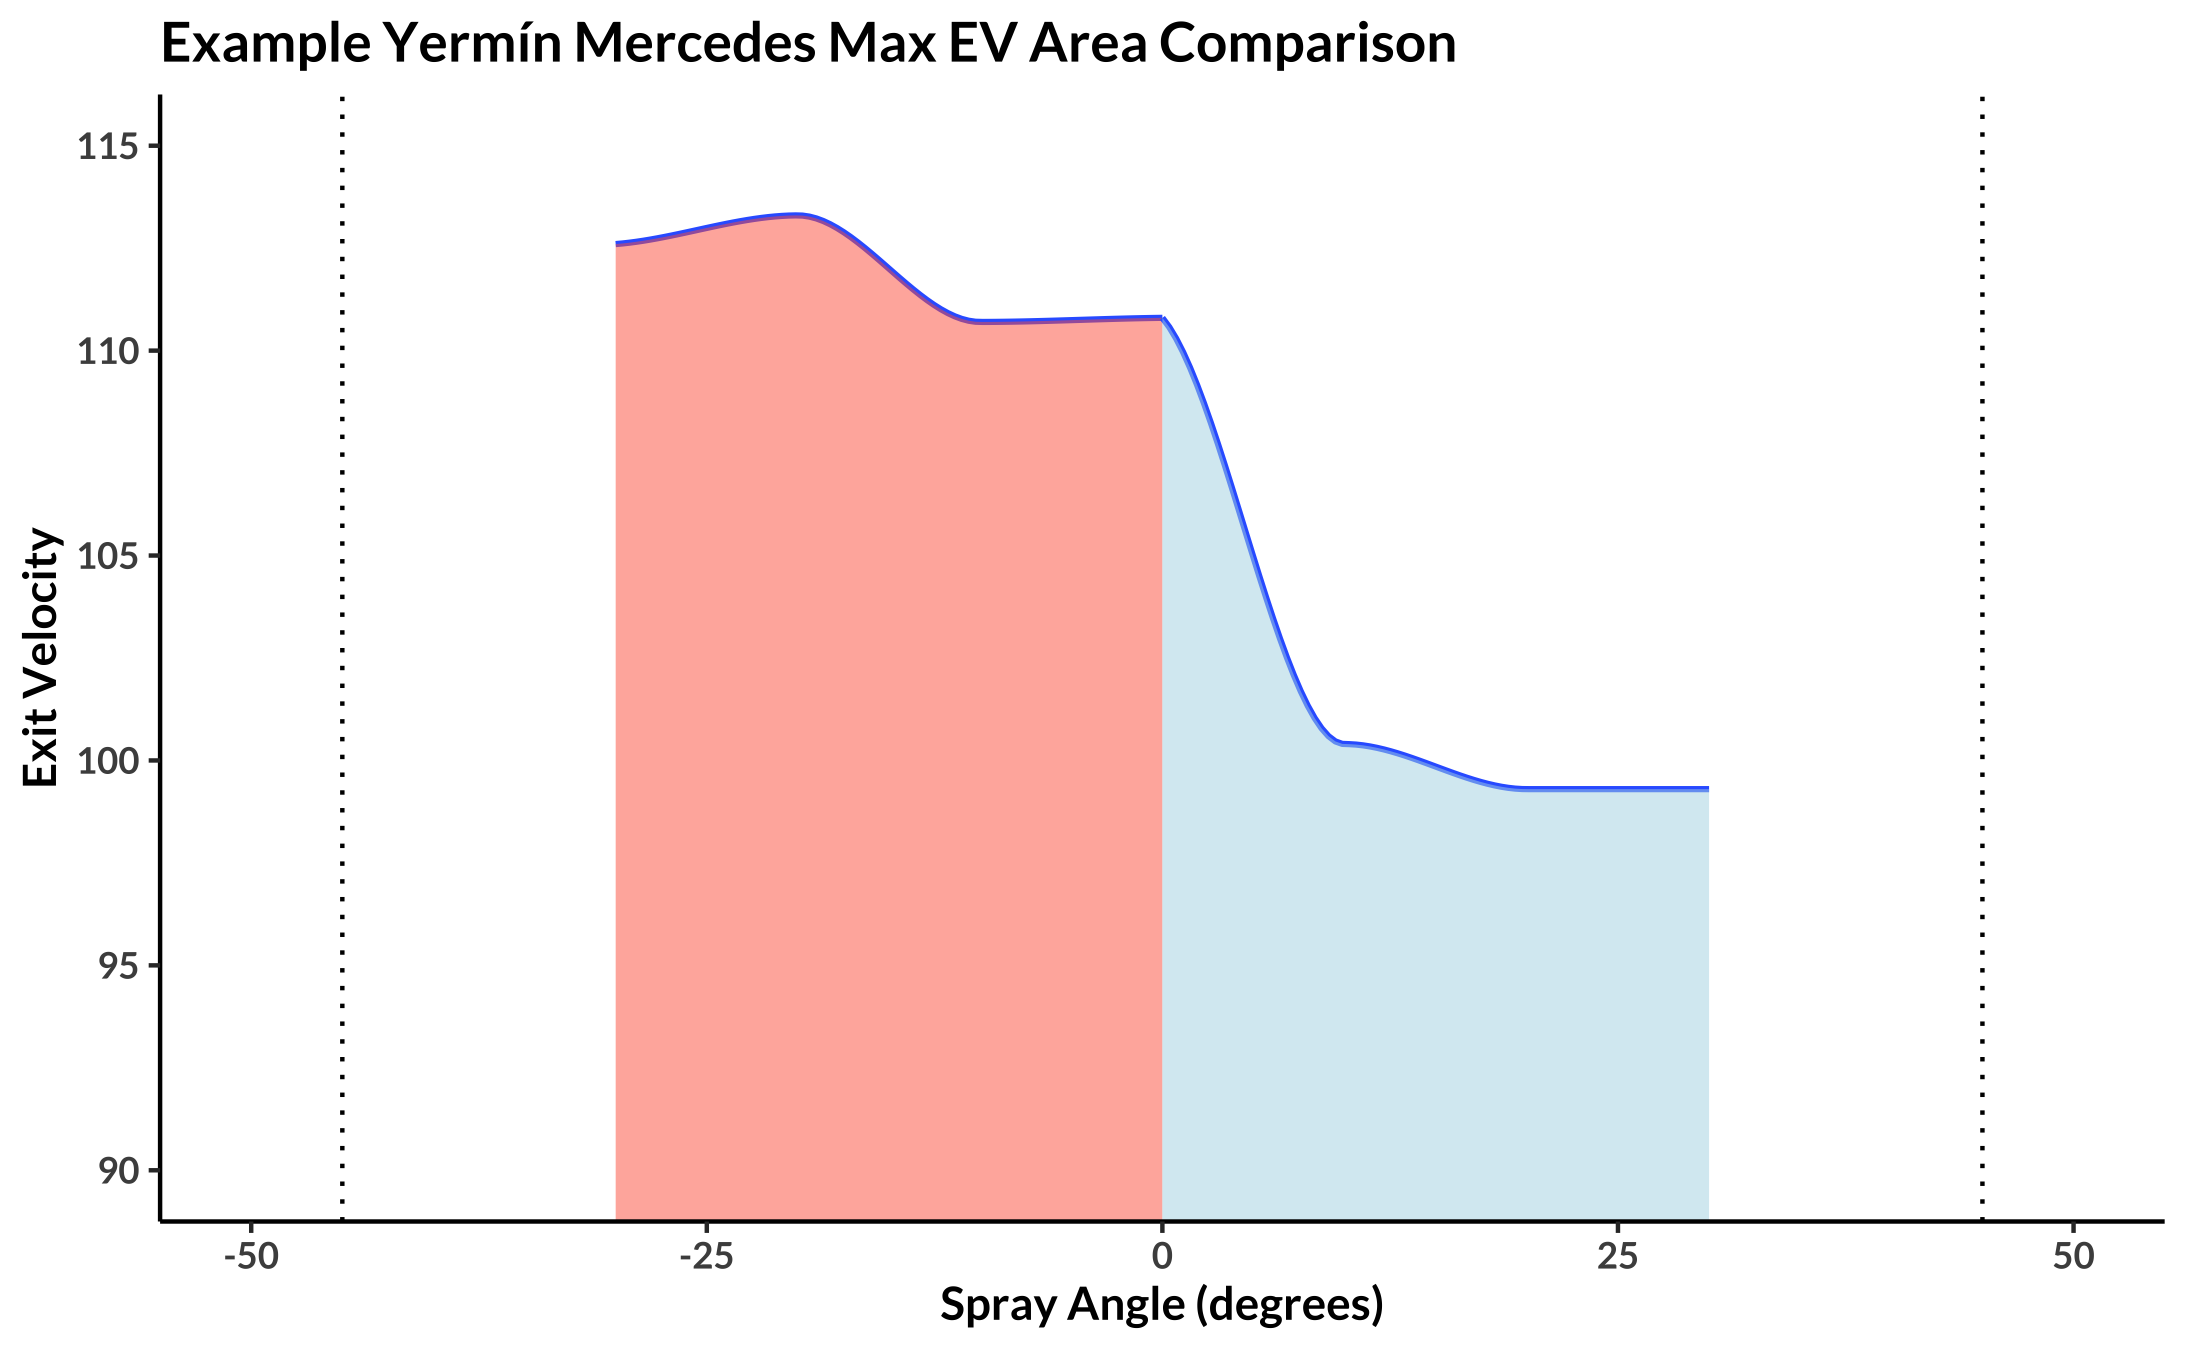
We intuitively recognize imbalance when looking at the shapes in front of us, so what we can do is compare areas under these arcs. If we want to measure a pull imbalance or a lack of well distributed, all-fields power, we can measure the difference in the area of the pull side arc against the opposite side arc. Rather than taking direct area differences and having to normalize, I’ll simply divide the pull side area by the opposite field area. Here’s an example of what I’m talking about:

Here’s the list of the highest ratios, otherwise known as the most pull-centric hitters this year.
| Name | Stand | Max EV | Max Foul | wOBA | Spray Ratio |
|---|---|---|---|---|---|
| Seth Brown | L | 113.7 | 112.8 | 0.292 | 1.12 |
| Jake Fraley | L | 107 | 95.2 | 0.396 | 1.1 |
| Yermín Mercedes | R | 116.8 | 117.7 | 0.332 | 1.1 |
| Josh Reddick | L | 104.8 | 105.3 | 0.304 | 1.1 |
| Jorge Polanco | R | 109.9 | 101.3 | 0.364 | 1.1 |
| Rougned Odor | L | 112.1 | 111.7 | 0.296 | 1.1 |
| Josh VanMeter | L | 104.1 | 103.6 | 0.278 | 1.09 |
| Patrick Wisdom | R | 111.5 | 107.7 | 0.459 | 1.09 |
| Steven Duggar | L | 109.1 | 101.8 | 0.419 | 1.09 |
| Manny Piña | R | 109.9 | 109.8 | 0.253 | 1.09 |
To ensure some consistency, and due to the lack of batted balls for a lot of players, I’m only using 30 degrees left and right of dead center. Extrapolating to foul territory would only make the ratio larger for Mercedes; accounting for that single foul ball could certainly tell you about the shape in the first place.
There is nothing definite about arbitrarily measuring and comparing areas. There is, however, a need to understand better how we diagnose offensive events with spray angle, because there are natural, physical limits to the swing that we often don’t think about enough. That one pulled foul ball might ultimately be telling a pitcher where Mercedes’s “A” swing is geared toward — an incredible feat of pull-power in the Statcast era, but maybe also a death knell.
I don’t have a new version of hard-hit rate to give you, but I hope the clip of Mercedes makes you think about the kind of swing path it takes to hit a ball that hard, that far, and still foul — and not just how you as a viewer see that kind of violent, rotational hack, but what information that could give the pitcher as well. Mercedes’ swing (given it’s the hardest he has ever hit a ball) is optimized to do the most damage on an inside pitch in front. But what happens when he gets a pitch that simply can’t align with that swing path?
Part of why I’m looking into this is because 2020 brought Hawk-Eye to all MLB parks, and thus a new stream for Statcast data. We were promised improvements not only in measurement accuracy but also in not missing as many batted balls in the first place. That has been true, but only if your classification of batted balls only extends to exit velocity and launch angle. As we go forward into the Hawk-Eye era, I’m not so worried about how we’re going to break down 18-point pose tracking data on players. I’m worried about all the hit location data we’re still missing, and how we can maybe infer something about swing paths when pairing that information with exit velocities and launch angles.
Foul balls are mis-hits in some way, but there’s arguably nothing mis-hit about a ball that comes off the bat at 117.7 mph and goes an estimated 480 feet. That is intent through mechanics and intent in swing speed. There’s more to the swing than just launch or no launch, and as future access to spray angle data allows, we’ll be better able to understand and discern swing paths deficiencies, and what is or is not ideal for individual players.
Owen is a contributor at FanGraphs. He got his start blogging about baseball when he was in college and you can find him maybe talking about something on Twitter @O_dotco.
Great topic! During the first few years after peak Andrew McCutchen, I would occasionally see him pull the ball completely out of the park over the third-base grandstand at PNC. He’s the only player I’ve ever seen do that, and it always meant he was struggling.