Jason Heyward’s Age-30 Season Looked A Lot Like His Age-20 Season

Here are two seasons, played 10 years apart:
| Year | PA | AVG | OBP | SLG | BB% | K% | ISO | wRC+ | WAR/600 |
|---|---|---|---|---|---|---|---|---|---|
| 2010 | 623 | .277 | .393 | .456 | 14.6% | 20.5% | .179 | 134 | 4.43 |
| 2020 | 181 | .265 | .392 | .456 | 16.6% | 20.4% | .190 | 131 | 5.96 |
We’re used to seeing a hitter’s numbers change over the course of that many seasons — sometimes improving in some areas, often declining in others. A table like the one above suggests both an incredible sustaining of abilities and an undying faith in approach. Ironically, that is not the story of Jason Heyward, a player who has been neither consistent in his performance nor trusting of his own approach, having tinkered constantly with his swing mechanics and his goals as a hitter. What the table above omits are the nine seasons between 2010 and 2020, which showed many different versions of Heyward that add up to a hitter far less valuable than the ones that bookend them.
| Year | PA | AVG | OBP | SLG | BB% | K% | ISO | wRC+ | WAR/600 |
|---|---|---|---|---|---|---|---|---|---|
| 2010 | 623 | .277 | .393 | .456 | 14.6% | 20.5% | .179 | 134 | 4.43 |
| 2011-19 | 4,957 | .260 | .337 | .407 | 9.8% | 16.9% | .148 | 104 | 3.21 |
| 2020 | 181 | .265 | .392 | .456 | 16.6% | 20.4% | .190 | 131 | 5.96 |
To me, this table is much more interesting than the previous one, providing more information and simultaneously prompting more questions. Heyward started off as a very good hitter, then averaged merely okay performances for the next nine seasons, then suddenly reverted back to his rookie self as a 31-year-old during a pandemic year. The second table is the story I’d like to talk about. (You may be asking, “Then why show us the first table at all?” And to that I say, writing ledes is hard.)
To be clear, Heyward had his bright spots between 2010 and 2020. His best slugging percentage came in 2012, when he hit a career-high 27 homers and recorded a .210 isolated power rating. His best batting average (.293) and best WAR (5.6) occurred in 2015, and his lowest strikeout rate (12.3%) came in 2018. Heyward has been able to do very well in one category or another plenty of times throughout his career. In terms of total offensive value measured by wRC+, though, his first season and his most recent one are his two best years by a pretty substantial margin. The downright eerie resemblance between the two gives us an interesting picture of how an optimized version of Heyward should operate at the plate.
We’ll start with his walk rate, since that’s such a huge driving force behind his on-base abilities and the overall value his offense produces. Heyward’s been good at drawing walks throughout his career, reaching double digits with his walk rate six different times and never running one under 8.5%. Far and away his two best walk rates, however, occurred in 2010 and 2020. That’s no accident: As you can see from the graph below, those two seasons represent outliers in his year-to-year swing rates.

This was almost certainly deliberate. Since joining the Cubs, Heyward had been swinging noticeably more often than he had when he was in Atlanta and St. Louis. Last year, the more games he played, the more patient he was.

This can be a tricky thing to pull off. Dramatically increasing the number of pitches you’re taking will certainly result in more walks, but it usually means your strikeout rate is going to swell a bit as well. Just ask Christian Yelich, who cut his swing rate by a league-leading 10.5 points in from 2019 to ’20 and saw a five-point boost in his walk rate but also a 10-point spike in his strikeout rate. Heyward’s strikeout rate, however, increased by less than two points as his walk rate went up by five points. That’s a major success, and one he already knew was possible because of the way he kept his strikeouts under control despite an ultra-patient approach when he was a 20-year-old.
And swing decisions aren’t the only area in which Heyward’s 2020 season mirrored his rookie year. His fly ball rate, a source of much discussion in the early parts of his Cubs tenure, also reverted back to 2010 levels.
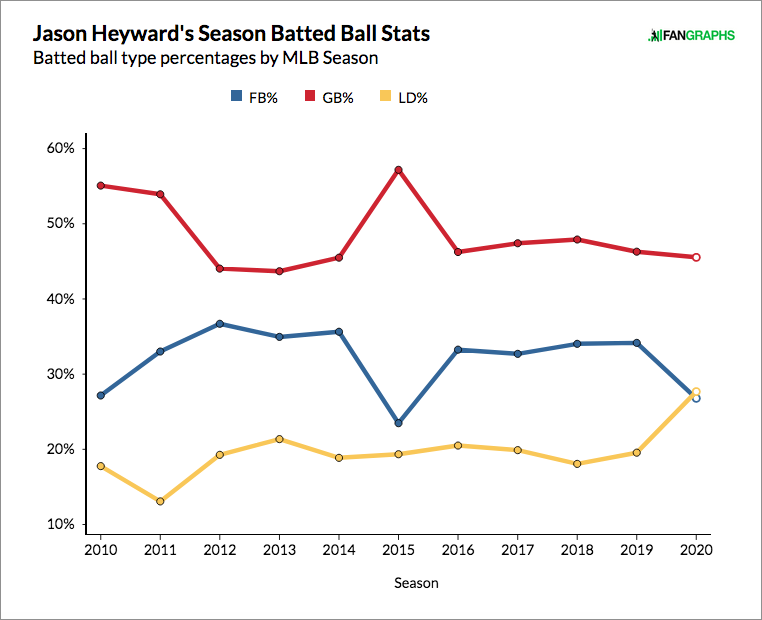
With the exception of his 2015 season — which, again, was the most valuable of his career — Heyward hadn’t run a fly ball rate under 33% since his rookie year. This is another significant development, since one of the Cubs’ main focuses after signing him was modifying his swing to get him to hit the ball in the air more in hopes of coaxing out more power. What happened instead, though, was too many of his flies were converted into easy outs, due in part to the fact that Heyward wasn’t hitting the ball with enough oomph to drive it out of the park. His average exit velocity since joining the Cubs peaked in the 41st percentile in 2018, and it was much lower in the two seasons before that. Consequently, his HR/FB% from 2016 to ’19 was just 8.8%. That figure placed him in just the 16th percentile of all qualified hitters in that span.
Even more promising is the fact that Heyward didn’t turn those fly balls into grounders, but line drives. Line drive rate can be hard to sustain year over year, so I want to be careful not to imply this should be the norm going forward. It is, however, another sign that his quality of contact in general took a major step forward. Of the fly balls that remained in Heyward’s game, fewer of them were infield pop-ups than in any year since 2012, and a career-high 20% of them left the park. In general, Statcast claims Heyward raised his Sweet Spot rate to 42% — nearly 13 points above his career average dating back to 2015, and over nine points better than the MLB average. Here’s what his radial chart from 2020 (right) compares with that of 2019.

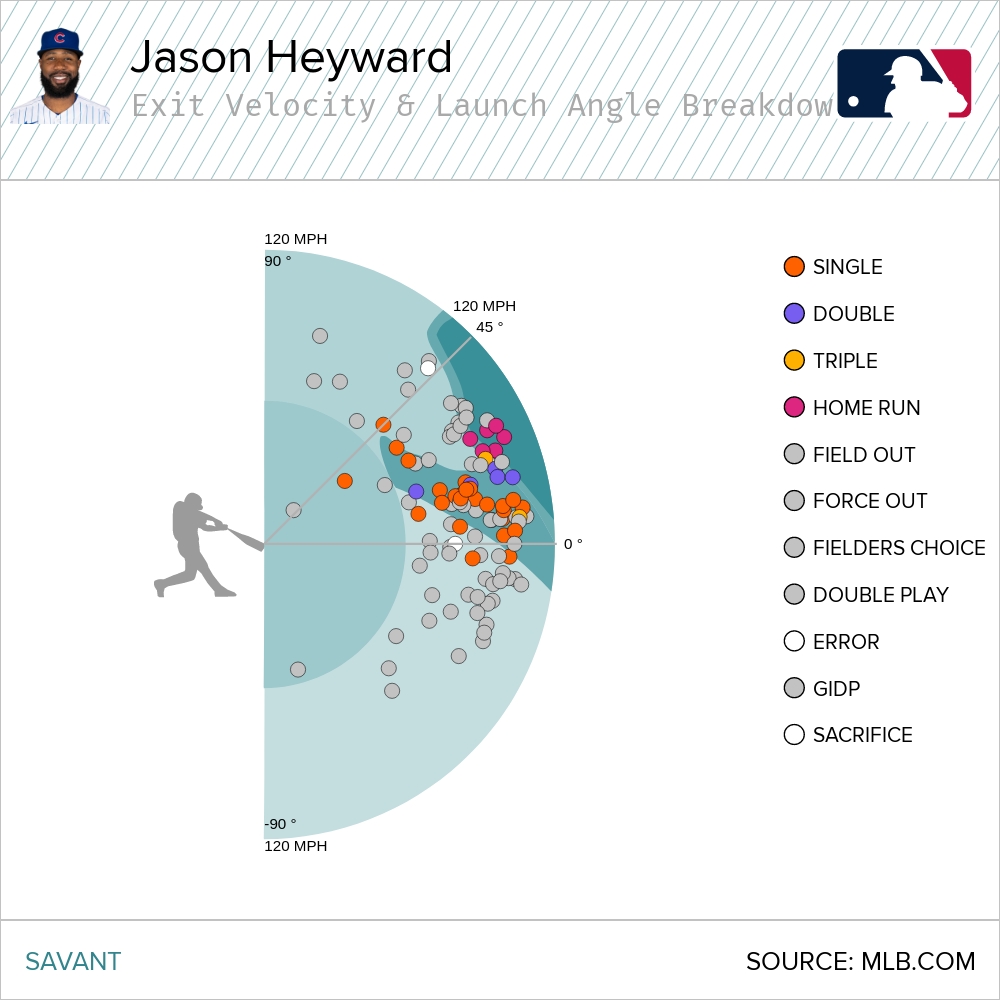
This kind of contact, combined with one of the best walk rates in baseball and an above-average ability to avoid strikeouts, is how a hitter who spent the entire Statcast era firmly in the bottom half of baseball in xwOBA suddenly jumped into the 91st percentile in that category in 2020.
It wasn’t a perfect season, but even Heyward’s lowlights include reasons to be heartened. Take his performance against left-handed pitching. The Cubs didn’t mess with letting him hit against southpaws: He took just 42 of his 181 plate appearances versus lefties. His performance in those situations seemed to justify that caution, too, as he recorded just a 55 wRC+. And yet his walk rate against lefties in 2020 was tied for his career best, and his .139 ISO against them was his best since 2013. If you correct for his .192 BABIP — easily his lowest ever in this split — those numbers against lefties might look a lot like they did … well, you can probably guess when.
| Year | PA | AVG | OBP | SLG | BB% | K% | ISO | BABIP | wRC+ |
|---|---|---|---|---|---|---|---|---|---|
| 2010 | 202 | .249 | .356 | .399 | 11.9% | 23.3% | .150 | .308 | 110 |
| 2020 | 42 | .167 | .262 | .306 | 11.9% | 23.8% | .139 | .192 | 55 |
Maybe it’s just me getting desperate to feel an emotion other than dread as we enter month 13 of quarantine, but this is genuinely inspiring to me. Think about how long we’ve been hearing about adjustments Heyward has been making in an attempt to reach his potential, particularly in Chicago. This is someone who had a 72 wRC+ in 2016, completely rebuilt his swing from scratch, and wound up with an 89 wRC+ the following year. A new hitting coach arrived in 2018, sparking guarded optimism that perhaps a fresh set of eyes could fix things. But even with another modest improvement, Heyward was still just average. Then, when he finally broke back out in 2020, he did so by going back to the way he first approached big league pitching as a prospect — before launch angle gurus, the pressure of $180-million contracts, and everything else could get to him. I like to think he was capable of this all along, and that he simply needed to trust the instincts he always had.
Whether that’s true or not, we can’t be sure right now. After all, anticipating the return of Heyward as a dangerous hitter has become an annual exercise in baseball analysis. Early on in both the 2018 and ‘19 seasons, my former colleague Craig Edwards wrote about how encouraged he was by something Heyward was doing at the plate, only to see his numbers dip later and result in yet another underwhelming stat line. He was hardly alone in his optimism. We’ve been burned by enough short bursts of greatness that it’s reasonable to be suspicious that this breakout occurred in a dramatically shortened season, one that could have simply ended too quickly for regression to rear its ugly head. But with the 2021 season nearly upon us, I’d like to buy into Heyward as a major offensive threat. We’ve seen exactly how he can pull it off, and this time, he might not be as willing to deviate from a good plan.
Tony is a contributor for FanGraphs. He began writing for Red Reporter in 2016, and has also covered prep sports for the Times West Virginian and college sports for Ohio University's The Post. He can be found on Twitter at @_TonyWolfe_.
I appreciate the acknowledgment that this isn’t the first time there has been optimism for Heyward. I was an early fan of his as a Braves fan, and I’ve always wanted him to figure out his approach at the plate. His athleticism, strength, and eye always made it seem as though a high level of success was inevitable, but it mostly hasn’t happened.
The other thing is that Heyward has not been a bad player. He’s basically Brett Gardner with fewer steals and a much better arm. In fact looking at each player from Heyward’s rookie year onward, they are very close in basically every single offensive category other than stolen bases. I don’t think Gardner would be viewed as a disappointment by any stretch, but he didn’t have Heyward’s pedigree.
I think another thing in the “Gardner vs. Heyward” debate (which i’ve only just come up with as a result of your post)- Gardy was never meant to be the centerpiece of any of those teams. He was always regarded as a slap hitting speedy OF guy who was always running at a constant motor.
Like you mention, Heyward had much loftier expectations that probably manifested in substandard performance when he was expected to deliver.
Every once in a while a player comes along who you can tell is too inside his own head. Heyward is a prime example. Changing stance, changing bat path in between games. For every Ripken that it works for there is a plethora of hitters who it didn’t work for. Baseball is a tough ass game. Even the smartest players end up eventually getting in the way of their own talent with constant tinkering. Heyward, at least to me seems like a guy who could be better in his 30s because he quits caring as much and/or would be better off just not thinking.
Good point about Gardner. The thing about Heyward is he’s had a really interesting career. In a different era, he wouldn’t make a lot of waves, just be a useful addition to most teams, not a huge amount of controversy. But his contract makes him a target. He’s only 31, could easily end up between 50-60 WAR, if he’s reasonably lucky on health.
Easily end up with 50-60 WAR? I am not sure he gets to 45. He has 33 fWAR now and has only been worth 8 fWAR over the last 5 seasons with the Cubs. With declining defense and the fact he usually doesn’t play 20 to 25 games a season he might get to 40 fWAR in 2024. He has almost no chance at 50 fWAR at this point.
I was looking at BWAR, which has him at 38.5, and the point of this article was he might be returning to age 20 form (in which he had 4.9 FWAR and 6.4BWAR. If he approaches that and sustains it, with aging curve factoring in, he could top 50.
“He’s basically Brett Gardner with fewer steals and a much better arm.”
And nine times the salary.
From 2016-2020, Brett Gardner accumulated 13.4 WAR compared to 7.9 WAR for Heyward. Gardner averaged a 103 wRC+ compared to 93 wRC+ for Heyward.
Gardner averaged around $13.75 million/year from 2016-2020., compared to $25+ million for Heyward. Gardner appeared in 629 games compared to 592 for Heyward.
Gardner has been the more productive player and the better value.
I have no idea how you came up with “ 9 times” but I assume it is stupid.
You’re cherry picking numbers, too. They have almost identical WAR (and every other stat) since Heyward’s debut. And what a player makes does not effect how good he is. They aren’t putting a mediocre player in the hall of fame if he nonsensically decided to play for the major league minimum his whole career.
Also, it’s impossible for me to care less about a player getting paid a lot for little production when there are regularly dozens of premier performers making pennies on the dollar compared to their worth due to built in salary depression rules of MLB.