Jay Bruce and Batted Ball Distance
Yesterday, our own David Golebiewski, looked at how Jay Bruce was progressing at the plate. In the comments, Jason461 noted that Bruce broke his wrist last season on July 12th and the injury could be the cause of some of his problems. Also, Jason461 stated that it takes about a year for a player to return to previous production when recovering from a wrist injury.
I have always followed players with wrist injuries after breaking my own wrist at the ripe old age of 20. Fourteen years later, my wrist is still not right. I, personally, don’t believe players can come back 100% after being off only one month for a broken wrist like Bruce.
I have previously looked at the effects of wrist injuries on individual players using spray charts. I have extended that analysis to Bruce. Here is a look at Bruce’s 2009 (pre-injury) and 2010 spray charts (images courtesy of texasleaguers.com):
2009 pre-injury:

2010:
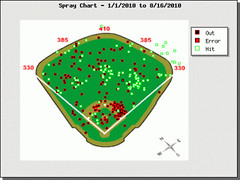
One noticeable difference is the lack of of deep power in 2010 to all fields compared to 2009.
I decided to make sure my eyes weren’t playing tricks on me and look at the average batted ball distance of all his batted balls (excluding bunts). I used a process I documented previously for determining the batted ball distance. The data is from MLB and marks where the fielder gets the ball, not where it lands. Though this data is not perfect, it is the best I have available to me. Here is a chart of the batted ball data for 2009 and 2010, including the monthly data for 2010:
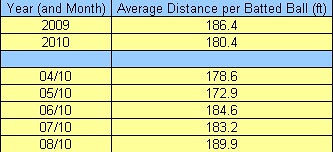
As it can be seen, Bruce is hitting the ball 6 feet less in 2010, vice in 2009 before the injury. In 2010, the batted ball distance has gone up ~10 feet from the beginning of the season to now. In the month of June, Jay started hitting the ball like he did back in 2009, so the claim of one year recovery time seems to be correct for Jay Bruce..
I am just beginning to look at the effects of injuries on players, but hopefully in the near future I have more information to publish. Please let me know if you have any questions and if there are any other players you want me to examine.
Jeff, one of the authors of the fantasy baseball guide,The Process, writes for RotoGraphs, The Hardball Times, Rotowire, Baseball America, and BaseballHQ. He has been nominated for two SABR Analytics Research Award for Contemporary Analysis and won it in 2013 in tandem with Bill Petti. He has won four FSWA Awards including on for his Mining the News series. He's won Tout Wars three times, LABR twice, and got his first NFBC Main Event win in 2021. Follow him on Twitter @jeffwzimmerman.
Great follow up. Exactly what I wanted to see after reading yesterday’s article on Bruce. The only thing more I’d like to see is his batted ball distance minus all GB, as a different percentage of GB from 09 to 10 will add noise to the overall batted ball distance.
I will run the numbers and post them later tonight.
I looked at fly balls and line drives
In 2009 he averaged 311 ft and averaged 32 degrees toward RF from CF.
In 2010, he is averaging 288 ft and at 14 degrees toward RF from CF.
In 2010 he is hitting for less distance on fly balls by 23 ft and is not get around as much.
Very little monthly data to use it.
Good idea.
Probably better to just compare FB only? His GB rate seems to have stayed static from 2009 to 2010 (an identical 38.5%). Though I’m not yet convinced either way if keeping LD balls makes any sense…
I looked at fly balls only:
In 2009 he averaged 320 ft and averaged 35 degrees toward RF from CF.
In 2010, he is averaging 295 ft and at 1degrees toward RF from CF.
In 2010 he is hitting for less distance on fly balls by 25 ft and is not get around as much.
Very little monthly data to use it.