Jay Bruce and Batted Ball Distance
Yesterday, our own David Golebiewski, looked at how Jay Bruce was progressing at the plate. In the comments, Jason461 noted that Bruce broke his wrist last season on July 12th and the injury could be the cause of some of his problems. Also, Jason461 stated that it takes about a year for a player to return to previous production when recovering from a wrist injury.
I have always followed players with wrist injuries after breaking my own wrist at the ripe old age of 20. Fourteen years later, my wrist is still not right. I, personally, don’t believe players can come back 100% after being off only one month for a broken wrist like Bruce.
I have previously looked at the effects of wrist injuries on individual players using spray charts. I have extended that analysis to Bruce. Here is a look at Bruce’s 2009 (pre-injury) and 2010 spray charts (images courtesy of texasleaguers.com):
2009 pre-injury:

2010:
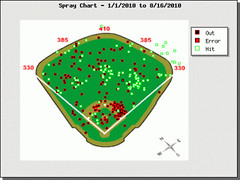
One noticeable difference is the lack of of deep power in 2010 to all fields compared to 2009.
I decided to make sure my eyes weren’t playing tricks on me and look at the average batted ball distance of all his batted balls (excluding bunts). I used a process I documented previously for determining the batted ball distance. The data is from MLB and marks where the fielder gets the ball, not where it lands. Though this data is not perfect, it is the best I have available to me. Here is a chart of the batted ball data for 2009 and 2010, including the monthly data for 2010:
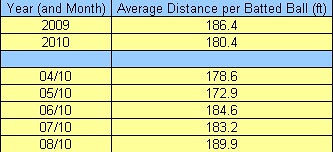
As it can be seen, Bruce is hitting the ball 6 feet less in 2010, vice in 2009 before the injury. In 2010, the batted ball distance has gone up ~10 feet from the beginning of the season to now. In the month of June, Jay started hitting the ball like he did back in 2009, so the claim of one year recovery time seems to be correct for Jay Bruce..
I am just beginning to look at the effects of injuries on players, but hopefully in the near future I have more information to publish. Please let me know if you have any questions and if there are any other players you want me to examine.
Jeff, one of the authors of the fantasy baseball guide,The Process, writes for RotoGraphs, The Hardball Times, Rotowire, Baseball America, and BaseballHQ. He has been nominated for two SABR Analytics Research Award for Contemporary Analysis and won it in 2013 in tandem with Bill Petti. He has won four FSWA Awards including on for his Mining the News series. He's won Tout Wars three times, LABR twice, and got his first NFBC Main Event win in 2021. Follow him on Twitter @jeffwzimmerman.
Great follow up. Exactly what I wanted to see after reading yesterday’s article on Bruce. The only thing more I’d like to see is his batted ball distance minus all GB, as a different percentage of GB from 09 to 10 will add noise to the overall batted ball distance.
I will run the numbers and post them later tonight.
I looked at fly balls and line drives
In 2009 he averaged 311 ft and averaged 32 degrees toward RF from CF.
In 2010, he is averaging 288 ft and at 14 degrees toward RF from CF.
In 2010 he is hitting for less distance on fly balls by 23 ft and is not get around as much.
Very little monthly data to use it.
Good idea.
Probably better to just compare FB only? His GB rate seems to have stayed static from 2009 to 2010 (an identical 38.5%). Though I’m not yet convinced either way if keeping LD balls makes any sense…
I looked at fly balls only:
In 2009 he averaged 320 ft and averaged 35 degrees toward RF from CF.
In 2010, he is averaging 295 ft and at 1degrees toward RF from CF.
In 2010 he is hitting for less distance on fly balls by 25 ft and is not get around as much.
Very little monthly data to use it.
It’s too early to tell for Tulowitzki, but he’s certainly a guy you might want to keep on your radar.
Jordan Schafer is the first guy that comes to mind. Great minor league numbers and off to a hot start in the majors, then attempts to play through a wrist injury that would eventually require surgery. He’s back to playing baseball this year but has been dreadful posting .203/.271/.258 in 304 PAs across 3 levels (Braves started him in AAA and he worked his way down).
Do we have any sense of what a standard variation looks like for this data? It would be nice to know that we’re looking at a real trend and not just shapes in the clouds.
Looking at the charts, I see just 1 warning track out in 2009 to the left of dead center. In 2010, he’s got 4. Those 10 feet are the most valuable in baseball. Give him a slight breeze behind him on 2 of those and you add 20 points to his slugging and 25 points to his OPS.
I think we often try to read too much in to performance as indicator of progress for the development (or lack thereof) of skills. While Bruce has not hit for as much power in 2010 as he has previously, I’m not sure that this data really suggests his ability to do so has been compromised.
This was my first thought too. Is a 3% difference (6 in 186) significant?
With all the other factors at play, it seems like it might not be.
I hope to have a better answer in the future. I have it near the top of my to do list (working on Tommy John Surgery effects right now). If you look at the comments above it can be seen when ground balls are removed, the difference is over 20 feet.
Has batted ball distance changed MLB-wide? The league-wide numbers might well fluctuate from season to seaslm, so you should adjust for that.
MLB occasionally changes the composition of the ball. That’s just one possible cause. Rather than compare one player’s season to that player’s subsequent season, compare his deviation from average in each of those two seasons.
Not sure why you’d include league averages for a particular player’s performance in this way. Changes in league average probably aren’t very predictive of individual player’s changes. (E.g. the league average can change because there is more emphasis on defense so hitters are selected less for their ability to hit the ball. But that wouldn’t change what you would expect of an individual player who has already been playing and who doesn’t need to work on his defense.)
Doesn’t the baseball travel further in hot weather? Wouldn’t you have to determine if the average distance for all hitters went up as the weather heated up?
Yes, atmospherics can have a significant effect. See “Home Run Park Factor: A New Approach” (and others) at the Hardball Times.
This was a huge oversite especially considering the following article:
http://www.beyondtheboxscore.com/2008/12/17/695875/what-factors-have-an-effec
I will just be using the yearly data for now
Rickie Weeks has had a few hand injuries and one somewhat significant wrist injury (no break as far as i know ) and he might be a good one to analyze.
You should look at Derrek Lee, his wrist injury in 06 was right after his best year by far and he’s never been the same since.
Looking at the graphs, in 2010 Bruce has learned how to pop up to the 3rd baseman.