Joey Gallo Is Really Scalding the Ball
Roughly one month into the 2019 season, we’re still in Weird Stats territory. So long as we are, it’s worth appreciating the extreme numbers some players are putting up before they vanish into the ether, and few players are more reliably extreme than Joey Gallo. I checked in on him in last week’s visit to the furthest reaches of hitter performance, but since then, something else he’s doing — not unrelated — has captured my attention.
While it seems that Gallo has been around forever — he was a first-round pick in 2012, made his first top-100 lists in ’14, and debuted in June of the following year — he’s still just 25 years old and has two full seasons and some fragments under his belt. In both of those seasons (2017 and ’18), he reached the 40-homer level, struck out about 36% of the time (with over two Ks for every hit), walked a good deal, and finished with batting averages in the low .200s. For all of the extremes, he produced WARs of 2.8 in both seasons, with better defense as a near-full-time outfielder in the latter season (as opposed to shaky third base play in the former) which offset his wRC+ drop from 121 in 2017 to 110 in ’18. That’s a solidly above-average player before you factor in the added entertainment value he brings with his light-tower power. Here, have a 442-foot homer:
In this young season, Gallo has been something quite a bit more than solidly above average, hitting .284/.393/.689 through Wednesday. He entered Thursday ranked second in the AL in slugging percentage, tied for fifth in homers (eight), sixth in wRC+ (172), and tied for 11th in WAR (1.0). I’ll get to some of the less flashy particulars below, but what drew me in last week was his 62.5% home run-to-fly ball ratio, more than double a 2017-18 rate (28.8%) that ranked fourth in the majors; he’s since dropped to 50.0%, and will continue to fall even if he does remain the highest among qualifiers. What caught my eye in following up was his average exit velocity to date: 99.1 mph, tops in the majors.
| Rk. | Player | BIP | LA | EV | FB/LD EV | GB EV |
|---|---|---|---|---|---|---|
| 1 | Joey Gallo | 44 | 19.0 | 99.1 | 102.7 | 91.0 |
| 2 | Aaron Judge | 48 | 12.6 | 97.9 | 99.7 | 96.2 |
| 3 | Nelson Cruz | 45 | 19.4 | 96.1 | 97.6 | 94.2 |
| 4 | Carlos Santana | 60 | 6.9 | 95.2 | 95.3 | 95.7 |
| 5 | Yoan Moncada | 71 | 12.3 | 95.2 | 98.7 | 91.8 |
| 6 | Franmil Reyes | 52 | 14.6 | 95.2 | 97.7 | 90.0 |
| 7 | Christian Walker | 55 | 15.2 | 95.0 | 99.0 | 90.6 |
| 8 | Christian Yelich | 74 | 14.8 | 95.0 | 98.9 | 92.6 |
| 9 | Anthony Rendon | 57 | 20.0 | 94.8 | 97.7 | 92.2 |
| 10 | Josh Donaldson | 55 | 9.5 | 94.5 | 100.3 | 90.3 |
Admittedly, exit velocity is not the be-all and end-all of Statcast measures. Launch angle matters, for one thing; 99 mph with a 15 degree launch angle, for example, produces an expected batting average of .726, while 99 mph with a -15 degree launch angle produces an average of .206. A writer-friend who knows much more about Statcast than I do suggested that hard hit rate (balls with an EV of 95 mph or above) might be a more useful gauge of Gallo’s current hot streak, but intuitively, it’s more difficult to grasp what a 50% hard hit rate means, or, in Gallo’s case, a 65.9% rate, without additional context (it’s second in the majors). A 99.1 mph average exit velo? That’s a lot of smoked baseballs. In Gallo’s case, 25 of his 44 balls in play have been hit at 105 mph or higher.
Forty-four balls in play is obviously not a lot, but the stat begins to stabilize at 40 balls in play, so we’re not talking about nothing here. Gallo has been in the leaderboard’s upper reaches in years past — second to Judge (94.0 to 94.7) last year, third behind Judge (94.9) and Cruz (93.2) at 93.1 mph in 2017, and second overall to Judge (93.7 to 95.0) for the 2015-19 period, so it’s not like he’s in radically different company.
Still, 99.1 mph as an average certainly seems like a jaw-dropper. In fact, as far as season-opening exit velocities go, it’s unprecedented. Using Baseball Savant’s search function, which goes by calendar dates rather than the number of games played (which won’t be uniform any point until 162 anyway), I pulled results through the first four weeks for each of the past four seasons as well as this one. I used a 40-ball cutoff, which requires some manual tweaking of the URL (change the figure following “min_results=” from 50 to 40) to incorporate our hard-mashing hero du jour:
| Rk. | Player | Year | Team | BIP | EV |
|---|---|---|---|---|---|
| 1 | Joey Gallo | 2019 | Rangers | 44 | 99.1 |
| 2 | Aaron Judge | 2019 | Yankees | 48 | 97.9 |
| 3 | Ryan Zimmerman | 2018 | Nationals | 61 | 96.3 |
| 4 | Nelson Cruz | 2019 | Twins | 45 | 96.1 |
| 5 | Nelson Cruz | 2018 | Mariners | 48 | 96.0 |
| 6 | Khris Davis | 2017 | A’s | 55 | 95.8 |
| 7T | Jose Abreu | 2018 | White Sox | 70 | 95.7 |
| 7T | Aaron Judge | 2018 | Yankees | 58 | 95.7 |
| 7T | Yoan Moncada | 2018 | White Sox | 45 | 95.7 |
| 10 | J.D. Martinez | 2018 | Red Sox | 54 | 95.6 |
| 11 | Miguel Cabrera | 2018 | Tigers | 62 | 95.4 |
| 12 | Manny Machado | 2017 | Orioles | 68 | 95.3 |
| 13T | Franmil Reyes | 2019 | Padres | 52 | 95.2 |
| 13T | Yoan Moncada | 2019 | White Sox | 71 | 95.2 |
| 13T | Carlos Santana | 2019 | Indians | 60 | 95.2 |
| 16T | Christian Walker | 2019 | Diamondbacks | 55 | 95.0 |
| 16T | Christian Yelich | 2019 | Brewers | 74 | 95.0 |
| 16T | Aaron Judge | 2017 | Yankees | 52 | 95.0 |
| 19 | Giancarlo Stanton | 2018 | Yankees | 57 | 94.9 |
| 20T | Anthony Rendon | 2019 | Nationals | 57 | 94.8 |
| 20T | Domingo Santana | 2016 | Brewers | 57 | 94.8 |
Hmm. Three of the top four results here are from the 2019 season, all with between 40 and 50 balls in play. Six of the next 10 on the leaderboard are from 2019 as well, suggesting that the predictive value of looking at where these guys ended up might be limited. Still, Gallo’s performance stands out; the injured Judge aside, he’s nearly three clicks ahead of the rest of the field, albeit with fewer balls in play thanks to those pesky strikeouts.
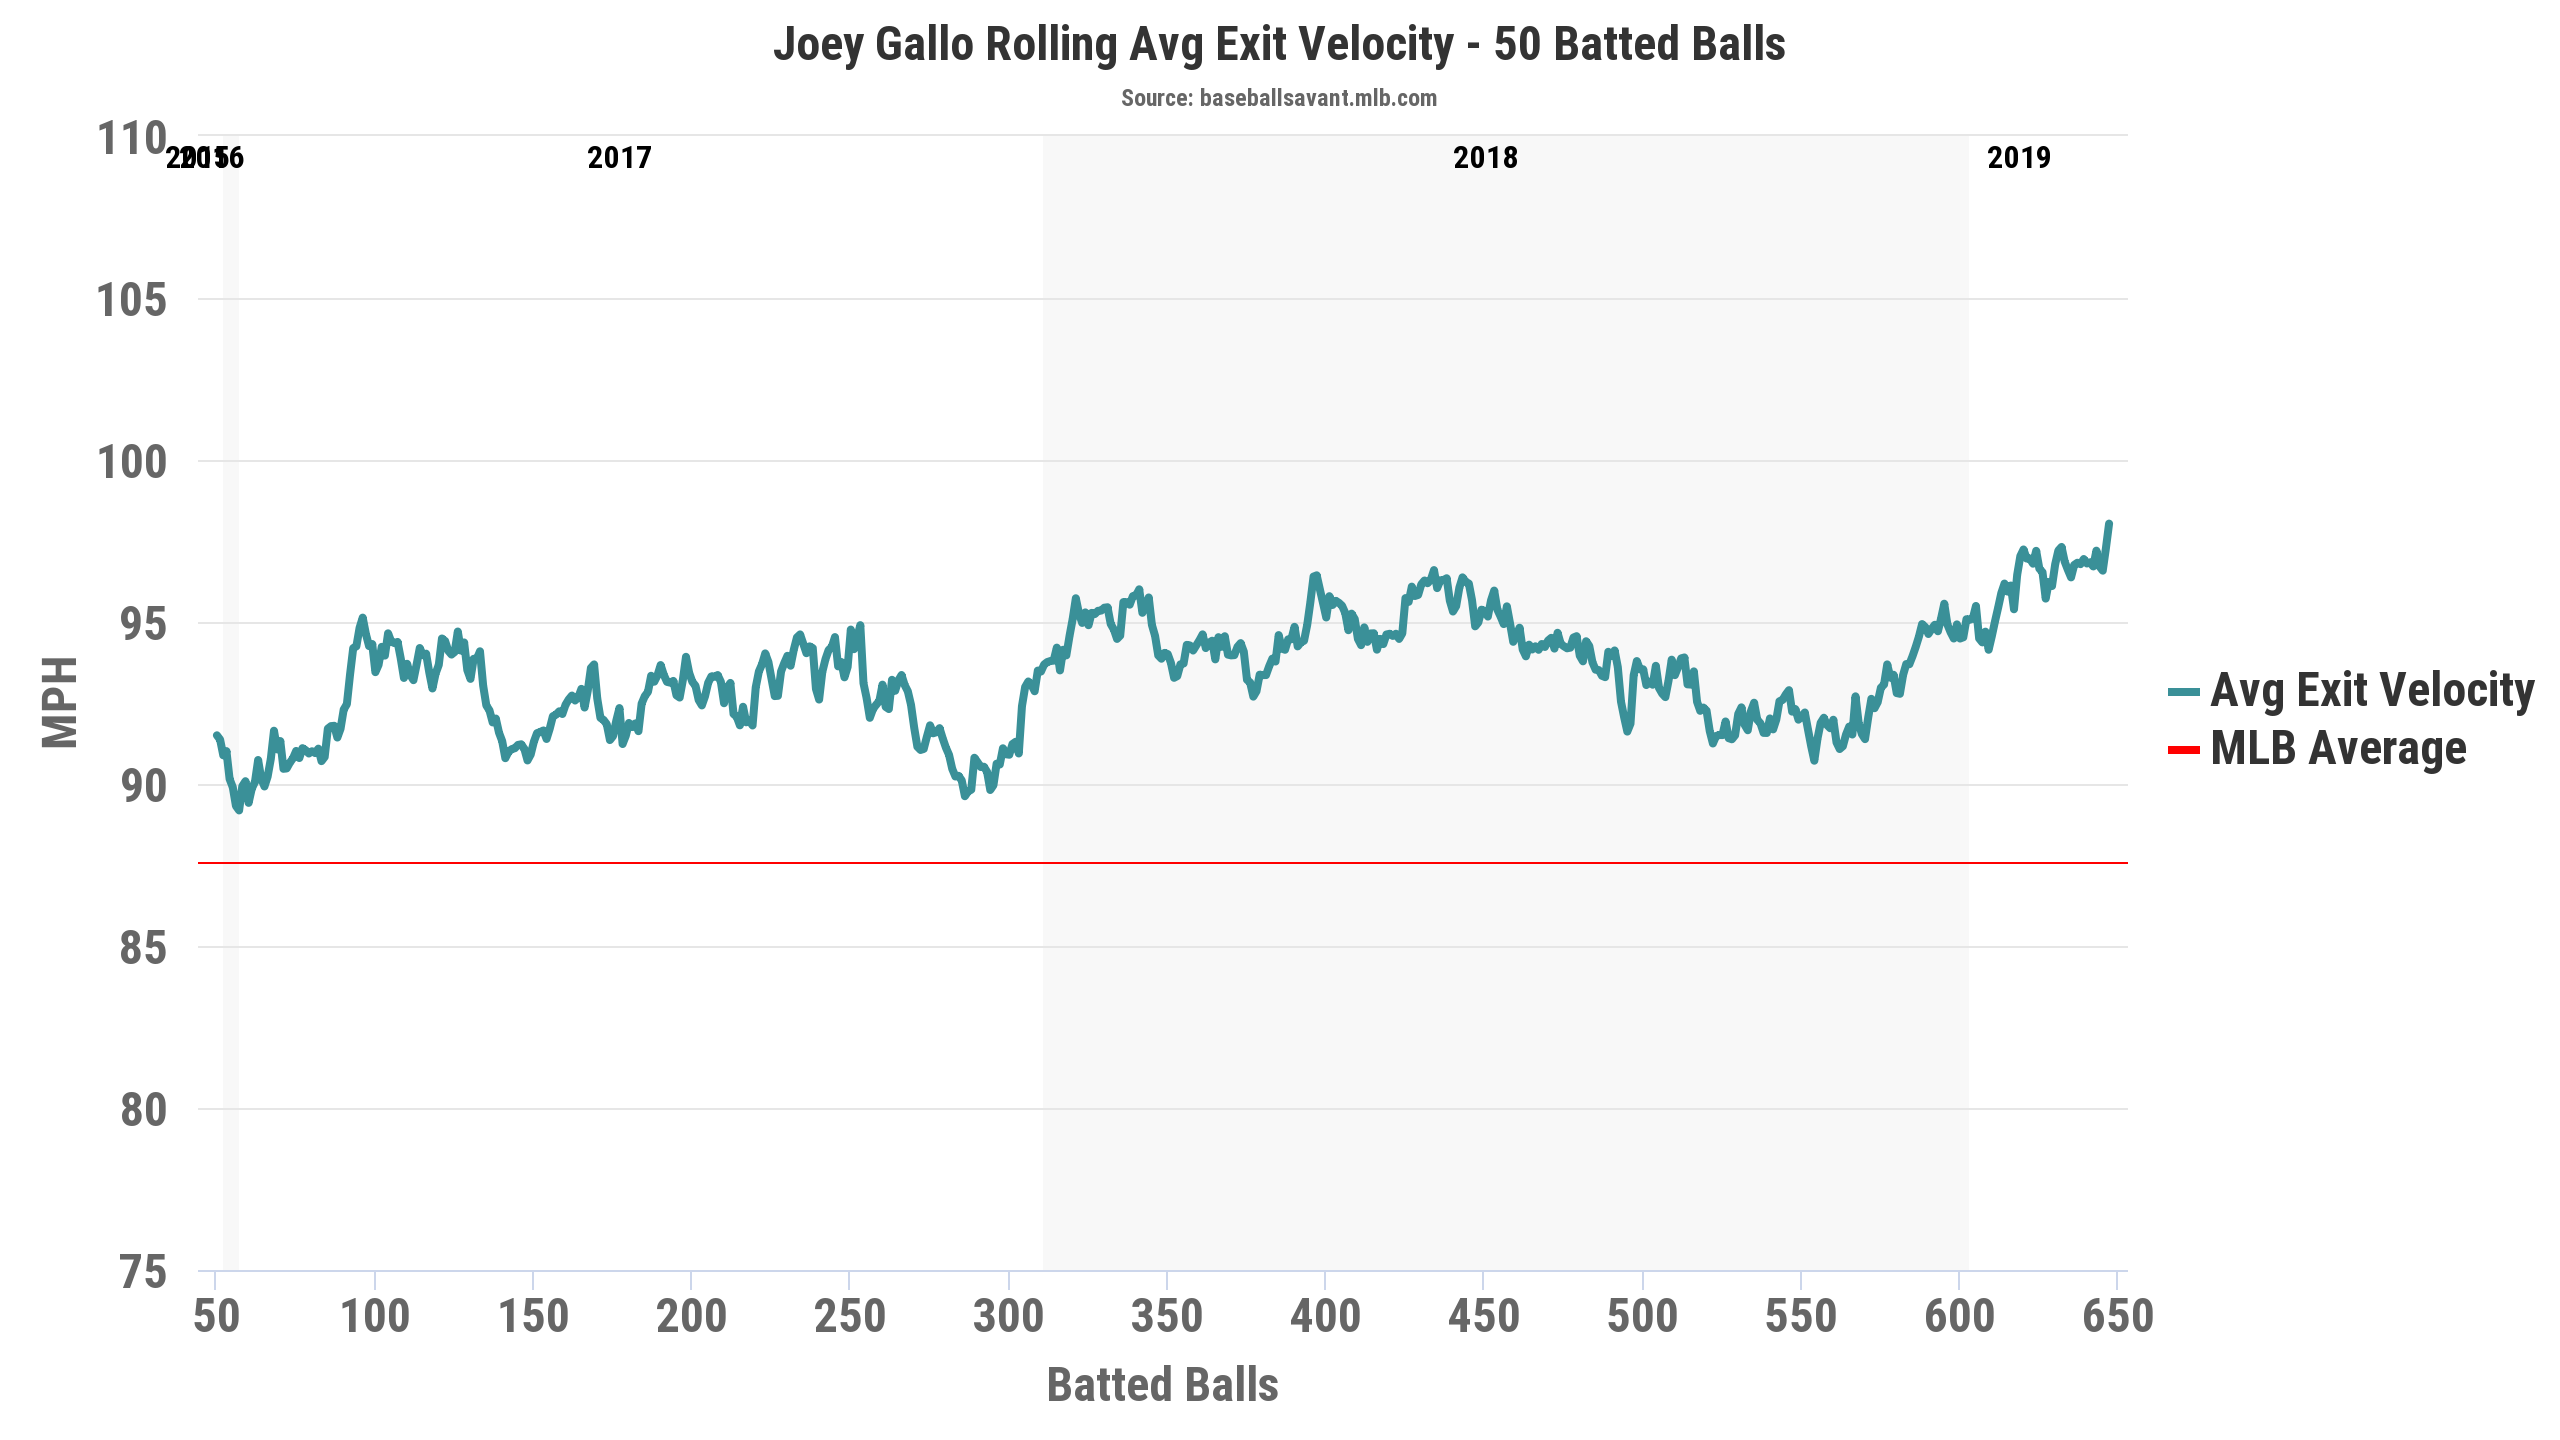
Looking at the matter a different way, while I don’t have access to a direct means of searching for the highest exit velocities over a span of 44 balls in play, the Statcast player cards do offer graphs of rolling averages at the 10-, 25-, 50-, 75-, 100-, 200-, and 500-ball increments. Here’s Gallo’s rolling average via 50-ball increments over the course of his career, which means that here I’m wrapping around to the end of last season. For that period, he’s at a career high of 98.0 mph, slightly lower than what’s above but still damn impressive.
Unable to automate a search, I manually checked each season’s top 10 hitters by exit velocity in search of their 50-ball peaks from any point in the Statcast era. Mercifully, this tedium turned out to involve just 31 hitters, thanks to the recidivists. To cover my bases, I threw in a few other players who cracked the top 50 seasonal exit velocities without landing in a yearly top 10. Even while considering only one peak per hitter — Judge, for example, has many a stretch in the 98-99 mph range — our boy Joey barely cracks the top 10 for a 50-ball stretch:
| Rk. | Player | Date Ending | Max50 | Final EV | Dif |
|---|---|---|---|---|---|
| 1 | Giancarlo Stanton | 8/14/18 | 100.2 | 93.7 | -6.5 |
| 2 | Miguel Sano | 5/3/17 | 99.8 | 92.3 | -7.5 |
| 3 | Aaron Judge | 6/16/17 | 99.7 | 94.9 | -4.8 |
| 4 | Nelson Cruz | 9/24/16 | 99.4 | 94.4 | -5 |
| 5 | Ryan Zimmerman | 8/23/15 | 99.0 | 91.7 | -7.3 |
| 6 | J.D. Martinez | 4/29/18 | 98.8 | 93.0 | -5.8 |
| 7 | Miguel Cabrera | 5/30/15 | 98.4 | 93.7 | -4.7 |
| 8 | Matt Olson | 6/12/18 | 98.1 | 93.1 | -5 |
| 9 | Joey Gallo | 4/24/19 | 98.0 | N/A | N/A |
| 10 | Matt Holliday | 7/3/16 | 97.7 | 93.0 | -4.7 |
| 11 | Khris Davis | 6/19/18 | 97.6 | 92.5 | -5.1 |
| 12 | David Ortiz | 8/16/15 | 97.2 | 93.0 | -4.2 |
| 13 | Christian Yelich | 4/20/19 | 97.1 | N/A | N/A |
| 14 | Josh Donaldson | 6/2/15 | 97.1 | 92.1 | -5 |
| 15 | Yoan Moncada | 4/16/19 | 97.0 | N/A | N/A |
| 16 | Mark Trumbo | 6/6/18 | 97.0 | 92.8 | -4.2 |
| 17 | Robinson Cano | 7/7/15 | 96.9 | 91.0 | -5.9 |
| 18 | Anthony Rendon | 7/10/18 | 96.8 | 90.6 | -6.2 |
| 19 | Tommy Pham | 7/28/18 | 96.7 | 92.8 | -3.9 |
| 20 | Mike Trout | 6/5/18 | 96.4 | 91.2 | -5.2 |
Gallo’s current stretch would rank fifth if… he… could… just… maintain… it… a few more days. The surrounding company is basically the same as the yearly leaderboards, but we’ve learned a couple of things. First, the entire population of hitters produces only a couple of stretches in the 98-mph vicinity per year. Second, even given these streaks of scalding the ball, the average falloff to a full season’s exit velocity from this upper level is 5.4 mph, which when applied to Gallo’s stretch would mean just 92.6 mph, below what he’s done for the past two seasons. Then again, since this is an active streak that’s still trending upwards — his past 25 balls in play average 100.8 mph, for example — maybe we haven’t seen its peak.
Beyond exit velocity, Gallo is producing a searing .493 xwOBA and a .787 xSLG — yes, his actual slash line may be underselling how hard he’s pounding the ball. Yet he’s actually hitting it on the ground with more frequency than before (31.8%, compared to 29.6% last year), but both that figure and his comparatively modest 36.4% fly-ball rate (down from 49.8%) are far from the point of stabilization at 80 balls in play. He’s still striking out a ton (34.8%, third in the league, down 1.1 points from last season), but he’s also walking more often (15.7%, tied for seventh in the league, and up 2.9 points from last year). With just 89 plate appearances, his walk rate hasn’t reached the point of stabilization (120 PA), however.
All of which is to say that while Gallo is off to a hot start with some eye-opening stats, and especially that exit velo, his propensity for strikeouts limits the numbers of balls he puts into play and hence some of the conclusions we can draw. He might be onto something, and considering how entertaining that could be, I dearly hope so. But as the famous sabermetrician Sigmund Freud once observed, sometimes a hot streak is just a hot streak. Here, have another dinger.
Brooklyn-based Jay Jaffe is a senior writer for FanGraphs, the author of The Cooperstown Casebook (Thomas Dunne Books, 2017) and the creator of the JAWS (Jaffe WAR Score) metric for Hall of Fame analysis. He founded the Futility Infielder website (2001), was a columnist for Baseball Prospectus (2005-2012) and a contributing writer for Sports Illustrated (2012-2018). He has been a recurring guest on MLB Network and a member of the BBWAA since 2011, and a Hall of Fame voter since 2021. Follow him on BlueSky @jayjaffe.bsky.social.
I was just looking at some of his swing path quality metrics – they are all showing significant improvement over last year – lower standard dev. of LA, more “square”/less backspin contact, lower IFFB rate, etc. His well-hit LA is also down about 3 deg. from the stratosphere which should help lower his K rate. Some very fundamental underpinnings – should drive a monster year.
Are “swing path quality metrics” a thing? I have not heard the term before. If it is a term, then it is misguided – but that’s common, like “barrels” are not actual barrels. It really does impede progress to call things by the wrong names. You get people talking about two things that have the same name but are not exactly related. Its intentional though – how else would you make people listen to something that they probably don’t care about? LA and EV are not simply products of swing path. You don’t swing at 30 degrees to create a LA of 30. You can swing down at a ball and have the ball go up… There are a lot of factors beyond the swing path, which is not at a constant angle itself. I will also offer up that backspin is better than square contact. You could just take any stat about Gallo’s April and conclude that there is improvement although I am sure AWS appreciates this methodology. Its weird to me that people who don’t understand a swing want to analyze them. Swings are not exactly a solvable problem.
i’m with you. I was not following his LA swing path theory and lower k percent from LA. I would be shocked if there is a strong correlation between LA and K%. Less swing and misses is definitely a correlation of swing path with a combination of better plate discipline, but not LA..
Chart here on well-hit LA vs. K rate…
https://imgur.com/dfdhGuD
This is interesting, is this your work or is someone else tracking this stuff?
Source of much of the comments provided below.
https://twitter.com/soxmoneyball/status/1087911303237304322
i still dont buy LA correlates to high k%. this graph above shows this.
As far as I can tell, neither chart speaks to LA vs. K%. Both are LA and K% and their respective correlations to attack angle, which is a term I’m not familiar with, but I assume refers to the swing plane?
A couple of points: There is a strong correlation between backspin, LA variability, IFFB rate and performance. Since many of the best performing hitters are consistently low in these metrics, it is safe to say that they matter. Article here: https://community.fangraphs.com/why-alex-bregman-will-out-regress-mookie-betts/
Also, higher backspin actually underperforms at the player level as hitters must accept the entire distribution of results that come with a particular strategy – article here: https://community.fangraphs.com/should-players-hit-with-backspin-the-data-might-surprise-you/
As far as quantifying the swing path, you might find the following article interesting -it proves what hitters are actually doing based on the data. It is quite surprising actually that the path for each pitch location is VERY different. Even more, hitter’s have subconsciously solved this very complex issue. Article here: https://community.fangraphs.com/are-ted-williams-hitting-philosophies-still-relevant-based-on-the-data/
In my view, what impedes progress is believing that there is nothing new to be discovered and defined when it is obvious, based on data, that hitters have subconsciously discovered things relating to swing path that is well beyond current conventional views. If you read the article(s), you will see that the best hitters have indeed (subconsciously) solved for LA variability – so yes, THEY are saying it’s a “thing”.
Great article. The two GIFs in this Gallo article are perfect visuals for what you describe – a flatter swing path for the fastball on the upper inside corner, then a steeper swing path for one on the lower inside corner.
Funny, but I think Gallo is also adopting another one of Williams’ philosophies this year. His swing rate is way down, both for in-zone and out-of-zone pitches. This greater selectivity probably is helping him avoid suboptimal contact, trading low EV balls in play for either called balls (higher BB%) or called strikes. I think the Splendid Splinter would be proud.