José Ramírez Is in a Quarter-Season Long Slump

In my short time so far at FanGraphs, there have been a couple of underlying similarities between the player profile-style pieces that I have written. All three of them have been about under-the-radar pitchers, whether it be about Chase Anderson or Dan Straily or Jimmy Yacabonis, and all three articles have focused on their individual pitches or repertoires.
Today, I will take a different tact. First, it’s about a hitter, and second, this hitter is not, by any means, “under-the-radar.” José Ramírez slashed .270/.387/.552 in 698 plate appearances last year, producing a total of 8.0 WAR, a figure that ranked third in all of baseball. Ramírez even had a solid case at the American League MVP award, finishing third behind Mookie Betts and Mike Trout. That’s really good! That’s better than really good; it’s elite. Ramírez has truly been one of the best players in baseball over the last three years now, and we should all appreciate that.
The problem is, though, José Ramírez actually hasn’t been good lately. And I’m not just talking about his slow start to the 2019 season (11 wRC+ in his first 20 PA); Ramírez’s slump has actually been quite long. Over his last 40 games, dating back to August 21 of last season, Ramírez has slashed .170/.298/.279 across 178 plate appearances. His 60 wRC+ during this stretch was the 17th-lowest in the major leagues, among 228 players with at least 100 plate appearances. That puts him in the undoubtedly-not-elite 7th percentile. Just to add insult to injury, this excludes the 2018 postseason, in which Ramírez did not record a single hit and managed just one walk across 12 plate appearances, good for a .000/.083/.000 line.
First, let’s break down the good of this slump. And, yes, there is actually some good to be analyzed.
Over these 40 games, Ramírez’s plate discipline has still been elite. He’s walked just as many times (25) as he struck out, which actually ranks tied for the 10th-best BB/K rate in that stretch. Both his swinging-strike rate (5.2% vs. 5.0% career) and his outside-the-zone swing rate (23.0% vs. 25.3%) in these 40 games are also just about as good, or better, than his career averages. At a minimum, this is very good to see. A slumping hitter who still manages to post good plate discipline numbers could mean a reversal of luck is soon possible. Ramírez has dealt with an absolutely horrid .187 BABIP during this stretch, something that will surely increase in due time.
So, are we able to conclude that this slump is purely as a result of poor luck? I’d say not so fast. There are indeed some concerning numbers in here, including a 27.2% hard-hit rate, an 11.5-point drop from his 38.7% hard-hit rate from Opening Day until the slump started. Also interesting is the fact that he’s seen a fastball just 48.7% of the time, a 1.4-point drop from 50.1% mark in those first 540 plate appearances. To fill the void, he has seen slight increases in both the frequency of curveballs and changeups.
These two factors seem to go hand-in-hand, until they don’t. Ramírez is indeed a phenomenal fastball hitter, having put up a .292/.375/.538 (153 wRC+) slash line against them in his career. He’s still pretty solid against changeups (152 wRC+), but he’s significantly worse against both curveballs (99 wRC+) and sliders (91 wRC+). But even with this noted, Ramírez hasn’t seen a huge jump in curveball-slider frequency (28.5% before the slump versus 29.2% during). And there haven’t been noticeable differences in where pitchers are pitching him, either.
One thing that is interesting from Ramírez’s pre- versus during-slump numbers is his pull-rate. Prior to his slump, Ramírez pulled 52.7% of his batted balls. During it, he’s pulled just 37.6%. (The MLB-average pull-rate was 40.3% in 2018.) And, pulling the ball is where Ramírez gets the majority of his power. When he pulled the ball last season, his hard-hit rate was 45.6%, posting a .530 wOBA and a 241 wRC+. But, when Ramírez went the other way, he posted a .188 wOBA and a 7 wRC+.
Why would Ramírez start trying to hit the ball the other way, especially if that’s not what works for him? One answer could be that he began trying too hard to beat the shift. Ramírez is a switch-hitter, and he was shifted at a drastically different rate when he batted right-handed (6.3% of the time) versus left-handed (53.0% of the time). If Ramírez was truly getting in his head and trying too hard to beat the shift, then we’d expect to see his pull percentage drop even further for when he hit lefty versus when he hit righty. And that’s exactly what happened. While Ramírez did see his pull-rate drop by not-insignificant 9.2 points as a right-handed hitter from prior to the slump to during it, his pull-rate dropped by 19.2 points (!) as a lefty.
What’s weird about this whole thing, however, are the resulting numbers. During the slump, Ramírez has posted a .355 wOBA on balls hit to the opposite field compared to just a .179 wOBA on balls hit to the pull side. But, numbers can be deceiving, especially if Ramírez is getting a lot of poorly-hit base hits to the opposite field. That’s why xwOBA would be a better metric to break this down, and, indeed, Ramírez’s pull-side xwOBA (.255) is still 95 points above his xwOBA to the opposite field (.160).
Here’s an example of a left-handed hitting Ramírez getting jammed on a pitch that’s middle-in, and still trying to take it to the opposite field. The exit velocity here is just 73.0 mph:
And now here’s an example of Ramírez again taking an inside pitch to the opposite field, but this time it results in a weakly-hit single. Across all of baseball in 2018, the average exit velocity on a single was 89.8 mph. This single was hit at just 82.6 mph:
Maybe he could have done more with those pitches if he pulled them, but maybe not. Still, the data is the data, and Ramírez is certainly trying to go to the opposite field a lot more often during this stretch of poor results than he was trying to beforehand. Whether that’s him consciously trying to avoid the shift or not, I don’t know.
Luckily for him, though, he’s actually faced a 40-game slump nearly as bad as the one he is currently in:
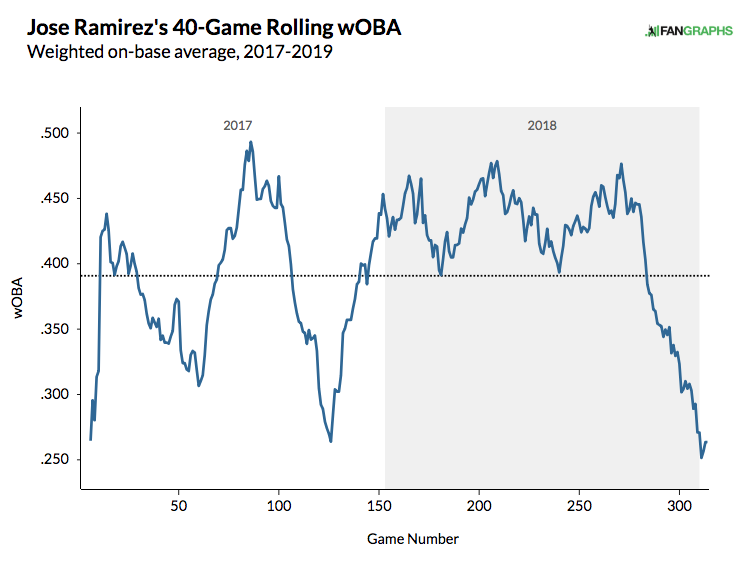
From July 14, 2017 to August 27, 2017, Ramírez had a 40 game stretch in which he posted a .264 wOBA and a 56 wRC+, the latter of which marks is actually worse than the wRC+ he is currently posting. Here’s a quick comparison of Ramírez’s selected stats during both of his slumps, along with his career averages:
| Slump | wOBA | BB% | K% | SwStr% | GB/FB | Pull% | Hard% | BABIP |
|---|---|---|---|---|---|---|---|---|
| 2017 | .264 | 5.9% | 11.8% | 4.7% | 1.02 | 51.8% | 25.9% | .254 |
| Current | .264 | 14.0% | 14.0% | 5.2% | 0.79 | 37.6% | 27.2% | .187 |
| Career Average | .357 | 9.6% | 11.1% | 5.0% | 1.03 | 44.0% | 30.1% | .291 |
As you can see, the slumps were similar, but different. In the 2017 slump, Ramírez still pulled the ball at an extraordinarily high rate; during this current slump, as I’ve already discussed, he has not. In his current slump, though, he’s still posting a higher hard-hit rate than he did in his first slump. A hot bat came back from that slump, so there’s no reason to think a hot bat won’t come back from this one. And as we’ve discussed, Ramírez’s plate discipline is also encouraging. Seeing that he’s still walking as much as he’s striking out suggests that he’s not pressing; he’s not trying to overcompensate for his recent poor performance. He’s still finding his pitches to hit, but for now, they’re just not falling (or going in the correct direction).
With all of this said, I don’t think there’s much to worry about here. I’m sure that the Indians, with one of the worst lineups in baseball, would like Ramírez to rebound sooner rather than later, but I’d be willing to bet that he does eventually turn it around. You can’t be one of the best hitters in baseball for a two-year span without being able to come back from a slump of this magnitude, and as it turns out, Ramírez has already done this once before.
Devan Fink is a Contributor at FanGraphs. You can follow him on Twitter @DevanFink.
Wander Javier is a slump free bat and coming to the AL Central soon. Save this tweet.
You’re going to have a hell of a time gaining traction with memes here.