Now in the Bullpen, Chase Anderson Should Change His Repertoire

As the Brewers lined up to open their division-winning 2018 season, right-hander Chase Anderson took the hill. By shutting out the Padres over six innings, allowing just one hit and striking out six, Anderson pitched the Brewers to the Opening Day victory, helping them win their first of 96 games.
Now, almost exactly one year later, Brewers manager Craig Counsell has announced that Anderson will be moving to the bullpen, opting to roll with a rotation of Jhoulys Chacin, Corbin Burnes, Brandon Woodruff, Freddy Peralta, and Zach Davies to begin the season instead.
This move is interesting for a number of reasons. First, it is true that Anderson has pitched poorly this spring, posting a 6.19 ERA across 16 innings. He’s allowed 11 runs, four homers, struck out 13 and walked four. But, for what it’s worth, Davies (7.17 ERA) and Burnes (5.79 ERA) haven’t looked much better, and each of them comes with fewer years of starting experience than Anderson.
The Brewers also have injuries in their bullpen and may need more depth there, something Anderson can provide. Both Jeremy Jeffress (dealing with a sore right shoulder) and Corey Knebel (out indefinitely with a partial tear of his UCL) are expected to begin the season on the Injured List. Still, it’s probably a bit unreasonable to expect Anderson to make this quick of a transition from being a starter to a reliever who can replace either Jeffress or Knebel, both very good backend arms. But maybe this move could be good for him and his performance.
He has tested out a new delivery in hopes of replicating the success he had in 2017 (3.2 WAR in 141.1 innings) after a disappointing 2018 (0.4 WAR in 158 innings). Clearly it hasn’t worked in the early going (and he actually ditched it), but a 72-batter sample during spring training probably isn’t enough to come to a true conclusion.
Nonetheless, Anderson is a reliever now, which could mean many different things. Our Depth Charts projections peg him for 45 innings out of the bullpen, at a 4.55 ERA, producing -0.2 WAR. We still expect him to make a 13 starts and pitch 75 innings out of the rotation, producing 0.4 WAR as a starter. Due to rounding, Anderson’s total projected WAR comes out as 0.3.
| Games | Starts | Relief Appearances | Innings | ERA | FIP | K/9 | BB/9 | WAR |
|---|---|---|---|---|---|---|---|---|
| 58 | 13 | 45 | 120.0 | 4.55 | 4.85 | 7.83 | 2.95 | 0.3 |
It wouldn’t be fair to call Anderson a “failed starter” by any means, but a la Andrew Miller or Wade Davis, it’s probably not unreasonable to expect Anderson’s stuff to play up out of the bullpen. He’ll be able to throw more pitches at max effort, allowing him to dial up the fastball.
Anderson’s “max effort” fastball velocity might be somewhere around 95 or 96 mph. According to Brooks Baseball, the fastest pitch Anderson has ever thrown was 97.5 mph, in 2017. Here is a chart showing his max fastball velocity each year:
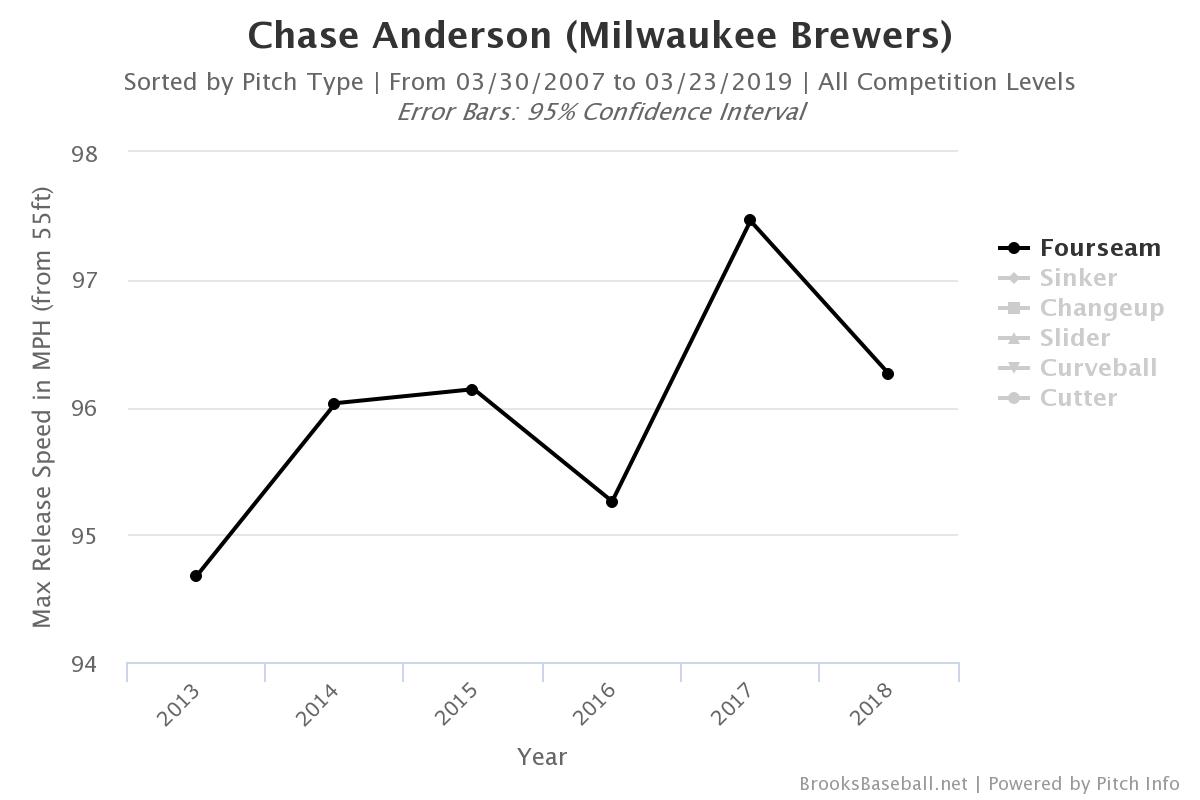
He probably won’t be pumping 95 or 96 mph out of the bullpen every game, but at this velocity, Anderson would still be throwing his fastball above the 2018 average for a relief pitcher. Plus, Anderson could put away some of his more ineffective pitches like his sinker (.473 wOBA allowed in 2018) or his cutter (.335 wOBA) in favor of his curveball (.241 wOBA) or his changeup (.262 wOBA). Since he won’t be moving through the order two or even three times, his traditional five-pitch mix won’t be necessary, at least while he’s working in the bullpen.
Anderson’s 2019 success might not fully be dependent on if (or when, perhaps) he decides to shrink his repertoire. As mentioned above, his 2017 season was much more dominant than his 2018; much of that success can be attributed to a HR/FB rate (8.6%) that was, by far, the lowest of his career. It jumped back up to 15.9% last year.
Hitters crushed his four-seamer, tagging it for 15 of his 30 home runs allowed. Considering he threw the fastball the most last year, it does make sense that he allowed the majority his homers with the pitch. He still threw the fastball 41% of the time and allowed 50% of his home runs with it. His sinker, too, was problematic; he used it 13% of the time and allowed 23% of his home runs with it.
(Interestingly enough, Anderson allowed seven home runs on his sinker in 2018. From 2014 to 2017, he allowed a total of nine home runs on the same pitch.)
| Pitch | Pitch% | HR Allowed | % of HR Allowed |
|---|---|---|---|
| Four Seamer | 41% | 15 | 50% |
| Changeup | 19% | 3 | 10% |
| Curve | 18% | 3 | 10% |
| Sinker | 13% | 7 | 23% |
| Cutter | 10% | 2 | 7% |
Anderson’s sinker has never been great. This chart shows Anderson’s wOBA allowed on his sinker by year and where that mark has ranked among all five of his pitches, with highest being the worst:
| Year | wOBA allowed | Rank In Repertoire |
|---|---|---|
| 2018 | 0.473 | Highest |
| 2017 | 0.354 | Highest |
| 2016 | 0.347 | Middle |
| 2015 | 0.374 | Highest |
| 2014 | 0.339 | Second-Highest |
By wOBA, Anderson’s sinker has been his worst pitch in three of his five major league seasons.
Maybe decreasing Anderson’s repertoire will help. It allows him to put away his two most ineffective pitches, focusing on a fastball, curveball, changeup mix that could easily improve his results. His fastball velocity will also probably jump, making that pitch more effective in of itself. There’s a lot to like there.
Who knows where Anderson’s ceiling lies as a reliever. He probably won’t become baseball’s next relief ace, but maybe this is a new opportunity for him to improve upon an underwhelming 2018 season.
Devan Fink is a Contributor at FanGraphs. You can follow him on Twitter @DevanFink.
Out of 120 qualified pitchers on the 2016-18 leaderboard Chase has the best ERA/FIP differential at -0.95 (3.71/4.67) & by a pretty comfortable amount with second place at -0.79.
Will be interesting to see if he can continue to outproduce his peripherals in the pen.