Juan Soto Will Bounce Back, but Can He Make the Necessary Adjustments?


There probably isn’t a good way to pitch to Juan Soto. The man is simply impossible: End up an inch outside the zone, and he’ll take the pitch in stride, celebrating the occasion with his signature shuffle. End up anywhere near his comfort zone, and he’ll lace it into the outfield for a double, or worse, over the fence for a home run. You just have to pray and hope that Soto messes up his timing. He’s been blessed with a preternatural knack for plate discipline to go along with legitimate power, and to wrap up this sentence, he’s very good.
At the same time, pitchers must be doing something right, because so far, Soto is having the worst season of his career. With a 125 wRC+ as of this writing that might be other hitters’ best marks, Soto looks merely mortal in 2022. So what’s going on? I don’t claim to have all of or even necessarily the right answers, but I have a few ideas.
Before proceeding any further, I need to stress that Soto’s underperformance is largely a product of bad luck, plain and simple. Soto has a .207 BABIP. Nobody has a .207 BABIP! Even Joey Gallo has a .256 BABIP. Batting average on balls in play is mysteriously down in 2022, but that’s nowhere near enough to explain why Soto’s been a bottom-dweller in this regard. Another quirk from this year: Nearly everyone is lagging behind their expected wOBA because Statcast metrics have not been calibrated to the new offensive environment. Even so, the gap between Soto’s actual and expected wOBA is the 28th-largest in baseball. Soto isn’t really behaving like an inferior version of himself. The contact is there. The discipline is there. We’re still in June, and there’s plenty of time for a correction to occur.
But it also seems like Soto’s underperformance is a result of pitchers better understanding his weaknesses. There’s no good way to pitch to him, yes, but there are ways of minimizing the damage. At this point, it’s no secret that a good chunk of Soto’s otherworldly output comes from ambushing the hard stuff. Here’s a graph showing Soto’s wOBA on contact by pitch type (fastballs, offspeed, breaking) in each season:
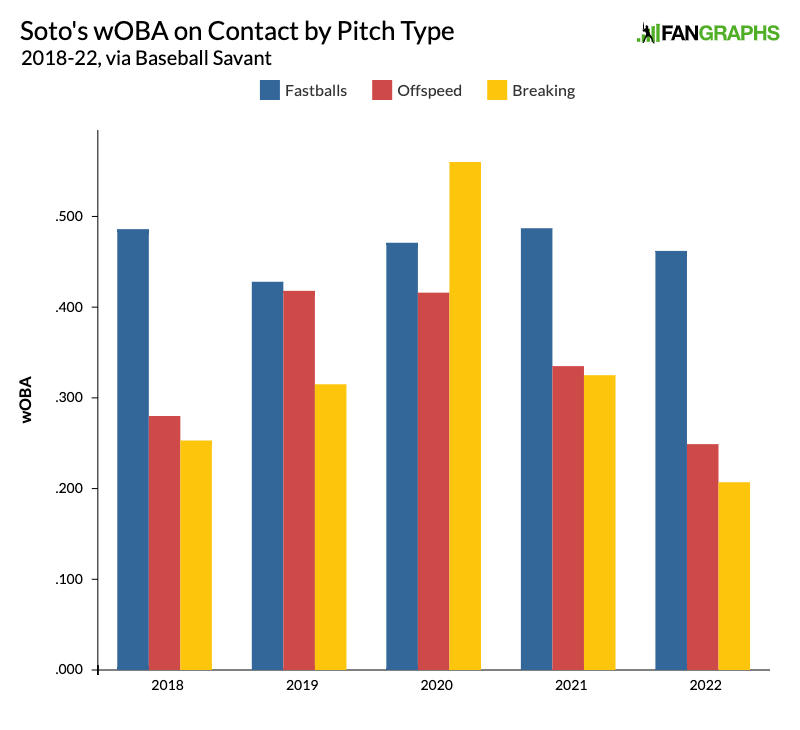
Indeed, Soto absolutely crushes fastballs. It more than makes up for his relatively modest numbers against slower, movement-heavy pitches, but if he ever goes berserk against them like he did in 2020, we’ll have an all-time season on our hands. Nonetheless, it’s easy to see what must be done against Soto. He’s seeing a career-low rate of fastballs this season: 50.9%, down from 55.6% last season. If we isolate four-seam fastballs, which Soto not only demolishes but also never swings at (literally), the drop is even more stark – he’s seeing them 26.8% of the time, as opposed to 34.7% of the time last season. When Soto recently brought up having a lack of pitches to hit, I’m guessing this is part of it. More than ever, opposing pitchers are unwilling to meet Soto on his own terms.
Because Soto has an insatiable appetite for fastballs, it’s pretty clear where in the strike zone he loves to attack. This time, here’s a heat map of Soto’s ISO (isolated power) per BIP (ball in play) by pitch location throughout his career. The data is a bit noisy, but you can see the areas that are flooded with red:
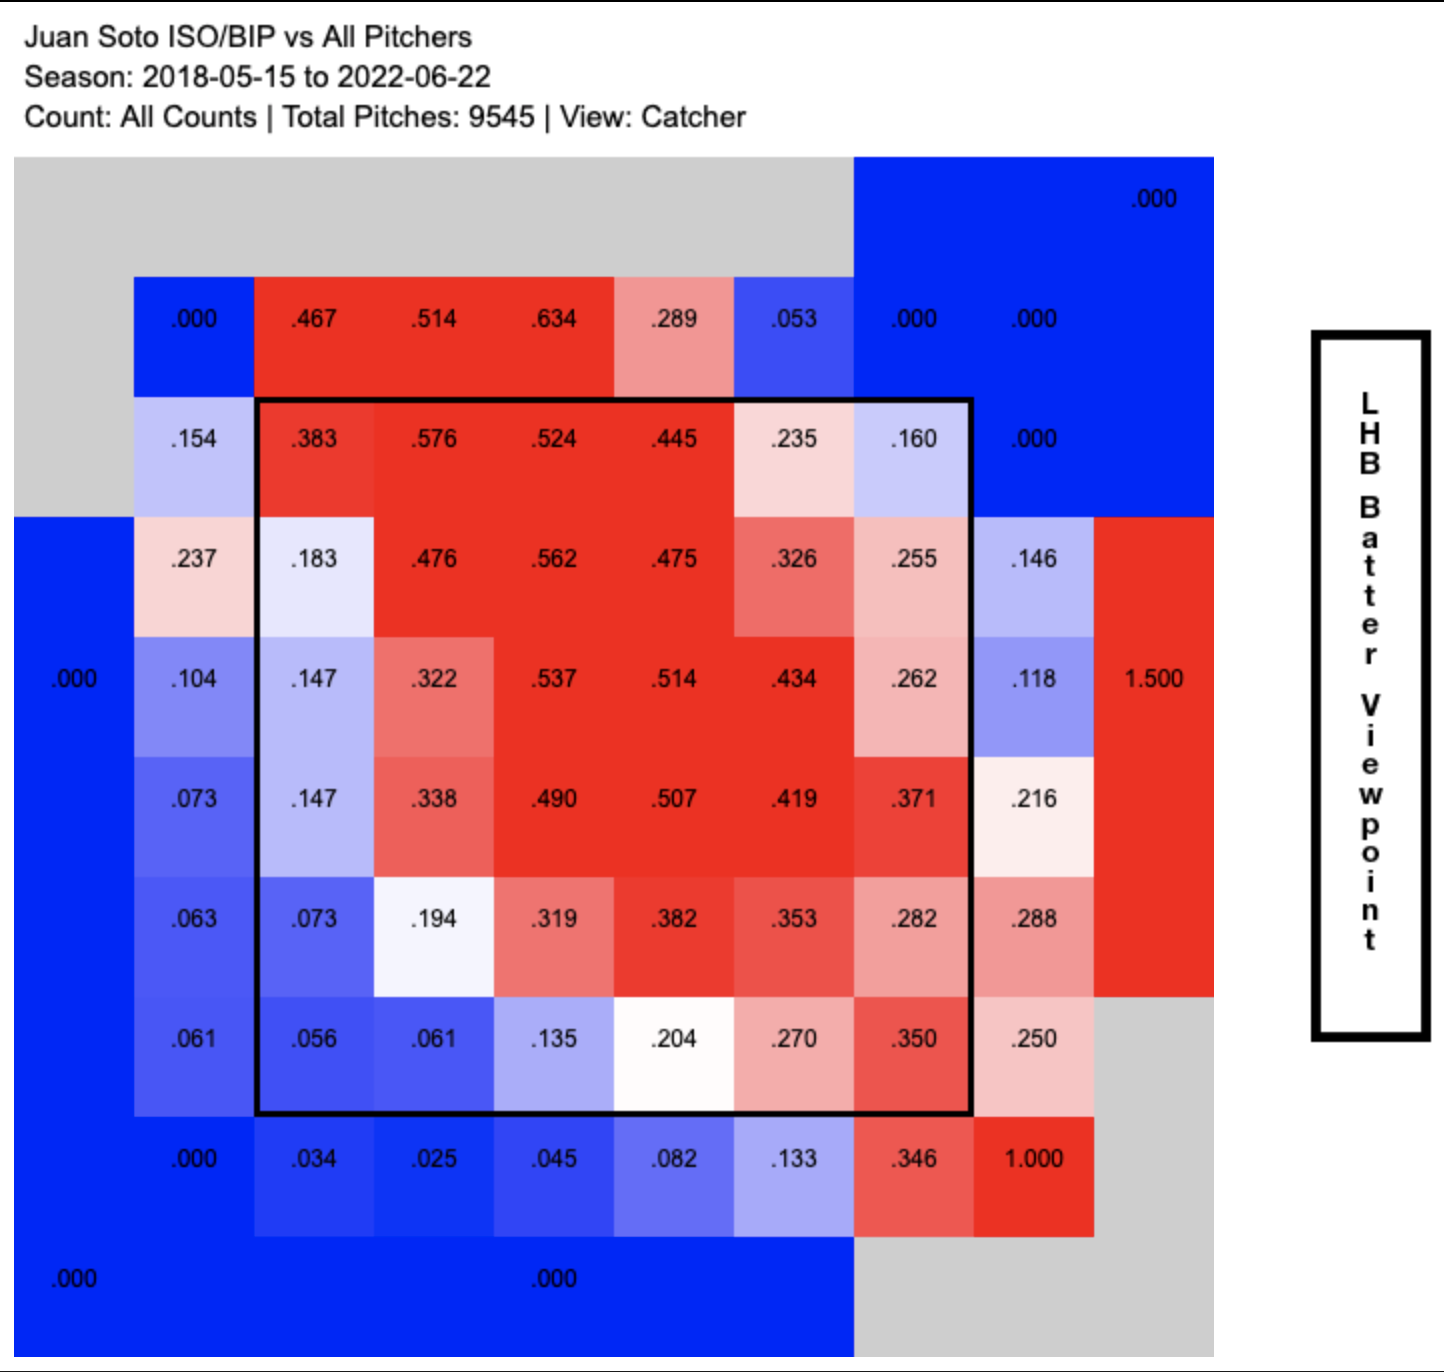
Fastballs usually end up near the letters. It’s no surprise, then, that Soto’s happy place is situated at the top of the zone. We can also tell where he isn’t so glad to be. See the lake of blue that’s low and outside from a lefty batter’s perspective? That’s traditionally been Soto’s weak point. Obviously, attacking it is easier said done, since any pitch outside the zone that isn’t perfectly executed will likely result in a ceremonial shuffle. But the challenge involved in doing so has yet to deter pitchers. The rate of down-and-away pitches against Soto has been steadily increasing, and this season, it’s at an all-time high of 27.4%.
The count doesn’t seem to have much of an influence on when pitchers are locating down-and-away. You’d think they’d shy away from a slider when Soto is ahead in the count, but at 26.7%, the down-and-away rate in that situation isn’t far off from the overall rate. In fact, pitchers’ down-and-away rate when Soto is behind in the count, when he’s potentially vulnerable, is down from last season. Perhaps what pitchers are looking for isn’t a strikeout, but rather weak contact. If you want to know why Soto doesn’t have the greatest ISO against pitches down-and-away, this spray chart provides a concise answer:
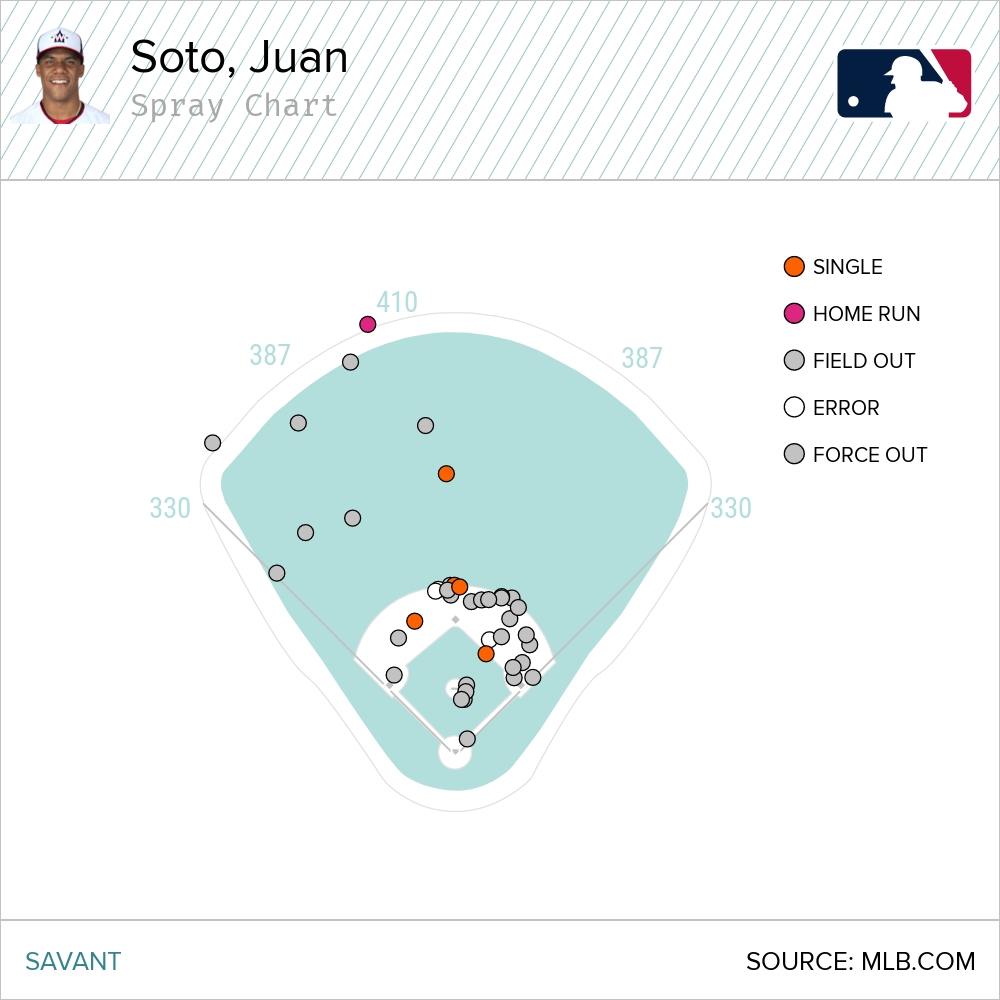
The points above represent every down-and-away pitch Soto has made contact against in 2022. They also reveal an odd dichotomy. When Soto hits the ball on the ground against such a pitch, he often does so to the pull side. That fact offers insight as to why teams are shifting against him so often – in 60.3% of his plate appearances, to be exact – despite Soto not being an archetypal pull hitter. The two-step strategy of pitching to where he’s less comfortable, then collecting a grounder has seemed to work – in a limited sample, at least.
When Soto hits the ball in the air against a down-and-away pitch, however, he often does so to the opposite side. Soto does not (and may never) pull a majority of his air balls due to the nature of his swing. He reacts later rather than earlier to pitches, which helps him spit on borderline pitches but also shifts back his point of contact, resulting in balls that fly the other way. That’s never been much of an issue; Soto has been one of the league’s greatest hitters since his arrival, after all.
Here’s the thing, though. The drag coefficient of the baseball right now is the highest it’s ever been in Soto’s major league career. As a result, fly balls and line drives are averaging the lowest recorded distance in the Statcast era. Certain air balls are more negatively impacted than others, however. You may have noticed that pull hitters aren’t reeling from the effects of a deader ball, mainly because their approach gives them room for error – pulling the ball maximizes exit velocity and thus results on contact. But hitters aiming for the opposite field need every foot they can get, and so far, the new ball has turned many of their home runs into harmless fly outs.
In this environment, it’s imperative for hitters to have pull-side power, even if it’s in their back pocket. Now, Soto isn’t all about left field, but what’s a tad concerning is how he’s recently been out of touch with his pull sensibilities. The table below shows the percentage of Soto’s fly balls and line drives hit the opposite way in each season, as well the corresponding results on contact:
| Year | Opposite% | wOBA |
|---|---|---|
| 2018 | 37.8% | .766 |
| 2019 | 37.2% | .472 |
| 2020 | 35.7% | .868 |
| 2021 | 39.1% | .548 |
| 2022 | 41.9% | .237 |
It’s not a huge uptick, mind you, but in a year where balls hit the other way are finding glove after glove, it’s left a notable dent in Soto’s production. The why is hard to pinpoint – all those down-and-away pitches seem like the culprit, but so does proprietary data that suggest Soto’s vertical bat angle has gotten flatter, contributing to an increase in mishits (and thus sidespin, which kills distance).
Even so, a .237 wOBA is awfully low, reminding us that the root of Soto’s issues is his rotten, rotten luck. Few things in baseball are this simple, but it’s true. That ghastly .207 BABIP has a far greater hold on his slash line than any combination of offspeed/breaking pitches, down-and-away pitches, and opposite-field air balls. Let’s face it: There’s about a 99% chance the part in this article about Soto “slumping” will become irrelevant within the next few months. Just consider last season, when Soto had a 128 wRC+ in the first half but a 199 wRC+ in the second half. He’s turned things around before. If he’s still anywhere near the Mendoza line come September, well, then we’ll talk.
Balls will start falling in for hits. Soto’s average will return to normal. After an anemic April, league-wide offense is surging. That doesn’t mean the aforementioned trends will disappear, however. They’re still a part of Soto’s muted 2022, with the potential to become more relevant once his BABIP springs back up. I have a sneaking suspicion that the projections for Soto’s power were inflated by the environments he played in prior to this season. Soto is clearly a generational talent. He’s someone who could succeed Mike Trout as the Best Player In the Universe, but for that to happen, he’ll need to adjust. He’ll need to subsist on a diet consisting of fewer fastballs, and he’ll need to start yanking more of his fly balls. I know associating anyone’s future with Trout is a ridiculous exercise, but looking at Soto, it’s hard not to get greedy. Pitchers have come up with their best response to his talents. It’s now his turn to return the favor.
Statistics in this article are through games of June 22.
Justin is an undergraduate student at Washington University in St. Louis studying statistics and writing.
Justin, nice article. Thank you
Thanks 🙂
Yes, really great. You could also point out that Soto has been especially bad with men on base – his WPA, RE24 and , especially WPA/LI are miniscule; HR/RBI ratio is almost comical. Does that correlate with how he is being pitched?