Let’s Look at a Few More Graphs About Hitter and Pitcher Ages
Earlier this week, I looked into the curious case of Benjamin Button. Er, no, that’s not right. I looked into the fact that the average age of big league hitters keeps declining, like Button, while pitchers haven’t followed suit. There are any number of possible explanations for that pattern, and if the mystery appeals to you, I highly suggest reading the comments of that article, where our excellent readers have advanced a number of solid theories. I think there’s plenty of meat left on the bone in figuring out what’s causing this trend, but I won’t be delving into that (much) today. Instead, I made like Woodward and Bernstein and followed the money.
Age is a decent proxy for service time; older players have generally, though not alway, been in the league longer than younger players. Similarly, service time is a decent proxy for salary; players who have been in the league longer generally make more money than newcomers, for a variety of reasons. So is our data really just saying pitcher salaries are going up? Well, kind of.
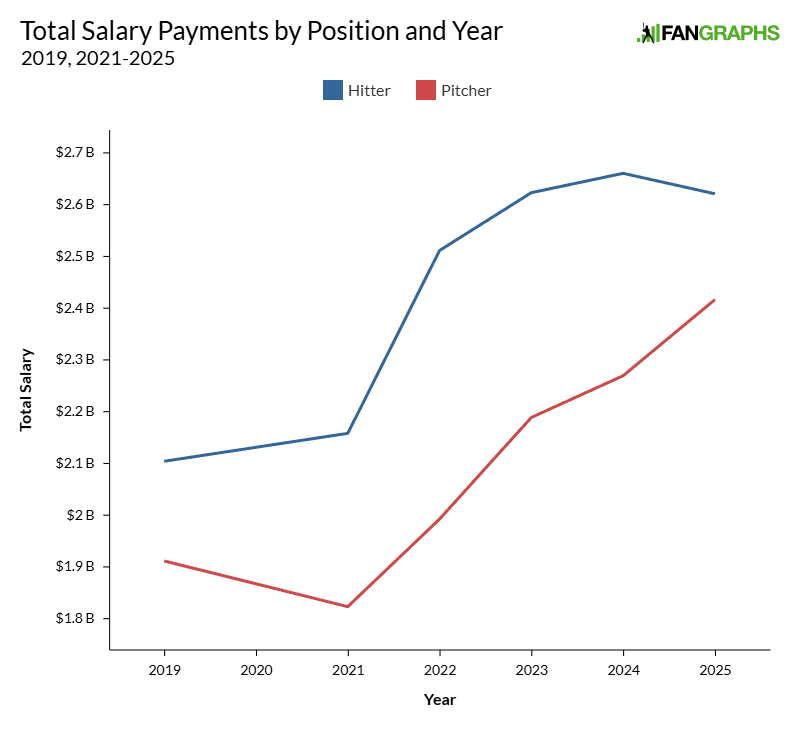
I took salaries for all major league players starting in 2019, discarding the abbreviated 2020 season. I split them up by type – pitchers in one bucket, hitters in another, and Shohei Ohtani in both. Total pitcher and hitter salaries have both gone up – passage of time, inflation, and so on. But after a huge increase heading into 2022, when seven different hitters signed nine-figure contracts, the total outlay to hitters has leveled off. Meanwhile, pitching salaries are catching up:
As an aside, I only pulled data through 2019 because it’s outrageously difficult to get complete salary data. If you’re looking for Opening Day annualized salaries, sure, those are reported. If you’re looking for free agency contracts, again, pretty easy to find. There are no disputes about what Freddie Freeman’s salary was in 2025; it’s public record. But what about Freeman’s former teammate Justin Dean, who racked up 52 days of service time in his debut season? What about split contracts? Late debuts? Up-and-down types? I worked out a method for what I consider a very good approximation of those salaries, but I don’t feel confident going back before the start of RosterResource’s database, which begins in 2019. Even then, this is approximate, though as I mentioned, I’m confident that it’s a good approximation.
I didn’t find much compelling evidence of the shift towards older pitchers and younger hitters in the salary data, at least at a high level. But that’s never stopped me before, and with such granular data, there’s no reason to settle for the 40,000-foot view. Next, I separated the hitters and pitchers by service time group to look at the percentage of positional spending going to each group over time. There’s no obvious fingerprint of changing economic behavior here:
| Year | Pre-Arb% | Arb% | FA% |
|---|---|---|---|
| 2019 | 11.3% | 27.3% | 61.4% |
| 2021 | 13.2% | 23.6% | 63.3% |
| 2022 | 12.8% | 25.9% | 61.3% |
| 2023 | 12.3% | 24.7% | 63.1% |
| 2024 | 12.7% | 24.2% | 63.1% |
| 2025 | 12.1% | 24.5% | 63.4% |
| Year | Pre-Arb% | Arb% | FA% |
|---|---|---|---|
| 2019 | 15.5% | 24.0% | 60.4% |
| 2021 | 21.0% | 22.1% | 56.9% |
| 2022 | 18.0% | 24.3% | 57.7% |
| 2023 | 16.5% | 25.5% | 58.1% |
| 2024 | 18.9% | 21.5% | 59.6% |
| 2025 | 17.3% | 19.7% | 63.0% |
But I did find something interesting after breaking the data up in this way. The share of innings covered by free agent pitchers spiked in 2025, while the share of innings covered by free agent hitters is fairly constant over the past half-decade. Much of the playing time goes to pre-arb players, particularly on the pitching end, which is intriguing in the context of average pitcher age:
| Year | Pre-Arb% | Arb% | FA% |
|---|---|---|---|
| 2019 | 48.2% | 25.2% | 26.6% |
| 2021 | 44.6% | 26.9% | 28.5% |
| 2022 | 45.2% | 28.7% | 26.1% |
| 2023 | 46.3% | 26.2% | 27.5% |
| 2024 | 48.6% | 24.8% | 26.6% |
| 2025 | 48.5% | 24.1% | 27.4% |
| Year | Pre-Arb% | Arb% | FA% |
|---|---|---|---|
| 2019 | 53.1% | 22.5% | 24.5% |
| 2021 | 53.7% | 23.2% | 23.0% |
| 2022 | 51.8% | 25.5% | 22.8% |
| 2023 | 50.0% | 25.2% | 24.8% |
| 2024 | 51.6% | 24.8% | 23.6% |
| 2025 | 51.1% | 21.8% | 27.1% |
That’s not really a new behavior, though. Teams have always used a lot of pre-arb pitchers. As we’ve covered extensively in these discussions, pitchers get injured a lot, and replacements must be found. That’s often a rookie up for a game or two, or perhaps a low-leverage reliever covering innings. Clearly, though, those guys aren’t sticking around long enough to affect the averages. Pre-arb pitchers grab a larger share of playing time than their hitter counterparts, but that flips by the time of arbitration.
Let me put all of these overlapping tables and percentages into a simple graph. What’s been going on in the past few years? Older pitchers are more important to teams’ plans, and so they’re getting paid:
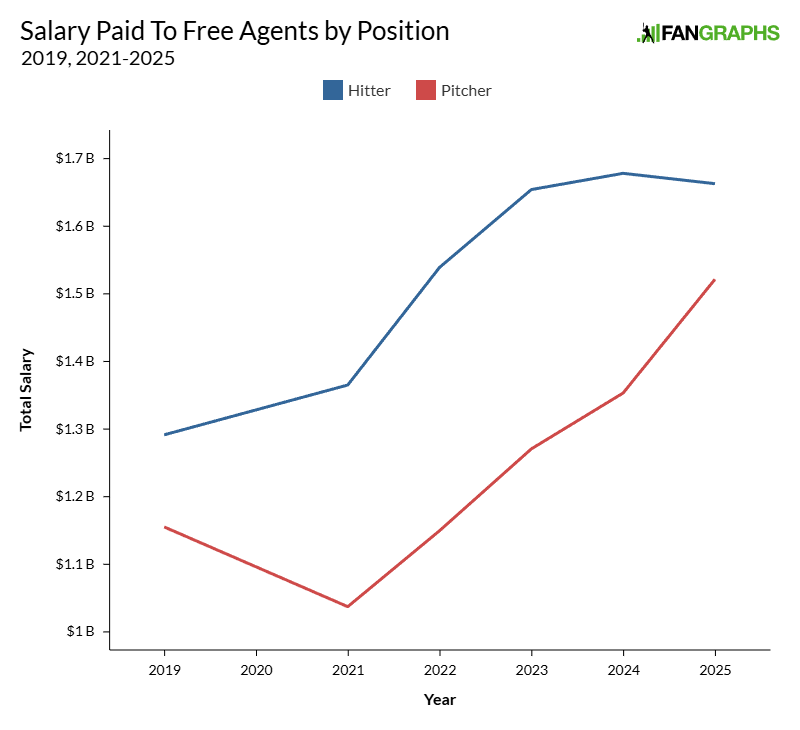
That changes the relative value of trading for a cost-controlled young pitcher. Why did the Cubs send a rich treasure trove of prospects to the Marlins for Edward Cabrera? I’m sure this isn’t the only reason, but a lot of it boils down to looking at that graph, drawing a trend line, and making a comedic “uh-oh” sound.
I hope I’m not projecting more confidence in my opinion of these trends than I actually feel. I find them phenomenally difficult to interpret. I have a great deal of uncertainty around each individual part of the equation. Will hitters keep trending younger while pitchers trend older? Maybe, but there are natural limits to that, and who knows what future training or talent acquisition patterns will look like? What would an international draft or further minor league contraction mean for amateurs? Will the money keep flowing to the same types of players? It’s very hard to know; this year’s free agency class is sending mixed signals. Can teams coax more innings out of their existing younger pitchers? What will the next CBA have to say about all of this, and about salary and roster construction in general?
I don’t even know how much I don’t know about all of those topics, which makes my opinion of the Cabrera trade and similar ones from last year decidedly uncertain. But if you made me put words to it right now, I’d say this: Too many teams at once got caught playing the same game of bringing in veteran pitchers to complement the hitters they’d so carefully and productively developed. At the same time, the Dodgers and the Mets, two teams that until recently were developing a lot of their own starters for better or worse, did the cost/benefit analysis and started bringing in free agent starters instead. The supply of veteran free agent innings might be up, but the demand is up by more than that. If you need pitching and don’t want to spend in free agency, you have no choice but to accept the current market rate for controllable pitching: the moon and the stars.
Is it worth it to move a bunch of prospects for controllable pitching now? Should you go with high-AAV one-year deals for veterans, hoping the fever will break after the next CBA? Is the correct move to just bite the bullet and pay Framber Valdez whatever it takes? Heck, should you just “punt pitching” for a year and hope to be uncommonly healthy? I’m glad that I don’t have to make these decisions. In the magical Christmasland where I’m running a baseball team, the world is already acting according to my wishes, so I’d just draft Paul Skenes. But in real life, you don’t get to do that. For front offices across the majors, it’s unquestionably one of the most important team-building dilemmas right now, and it’ll be fascinating to see the rest of this winter’s free agency period play out.
Ben is a writer at FanGraphs. He can be found on Bluesky @benclemens.
How do players who sign pre-arbitration and pre-FA contract extensions factor into this? Is it possible that teams are preferentially extending young bats vs arms and this is holding down hitter salaries overall?