Liam Hendriks, AL All-Star
The past year has been a whirlwind for Liam Hendriks. A little over a year ago, he was designated for assignment by the Oakland Athletics. At that point in the 2018 season, he was sporting a 7.36 ERA with an ugly 6.43 FIP while also missing more than a month with a groin strain. No one claimed him on waivers and he was sent outright to Triple-A. He worked hard to regain his confidence while also honing his repertoire. He was recalled in September and pitched well enough as an opener to get the start in the Wild Card game against the Yankees. However, that game didn’t go to plan after an Aaron Judge two-run homer got the home team on the board early.
Even after all those setbacks, Hendriks has flourished as a critical piece in the A’s bullpen this year. He started the year in a familiar role, making a couple of opener starts and coming out of the pen as a middle reliever. But as the back-end of the Oakland bullpen began to struggle, Hendriks found his way into higher leverage situations. The climax of his year-long turnaround came when he was named to the American League All-Star team as a replacement for Charlie Morton.
Here’s how Hendriks stacks up against his fellow All-Star relievers and a few other top candidates.
| Player | IP | SV | K/BB | WPA | ERA- | FIP- | WAR |
|---|---|---|---|---|---|---|---|
| Liam Hendriks | 48.2 | 5 | 4.07 | 1.85 | 21 | 45 | 1.8 |
| Brad Hand | 37.1 | 23 | 5.50 | 1.49 | 46 | 41 | 1.5 |
| Aroldis Chapman | 34.2 | 24 | 4.17 | 0.62 | 39 | 38 | 1.4 |
| Ryan Pressly | 39.2 | 3 | 7.83 | 1.61 | 31 | 57 | 1.2 |
| Shane Greene | 33 | 22 | 3.40 | 1.27 | 24 | 80 | 0.7 |
| Ken Giles | 31 | 13 | 5.89 | 1.19 | 32 | 32 | 1.4 |
| Roberto Osuna | 37 | 19 | 6.50 | 1.73 | 44 | 60 | 1.2 |
| Ty Buttrey | 42 | 2 | 4.17 | 0.39 | 58 | 62 | 1.2 |
| Taylor Rogers | 39.2 | 12 | 7.29 | 2.56 | 39 | 59 | 1.2 |
| Ian Kennedy | 35 | 11 | 5.25 | -0.19 | 78 | 51 | 1.1 |
Any of the other candidates listed above could have been chosen and no one would have batted an eye (ok, maybe not Ian Kennedy). But Hendriks leads the AL in WAR as well as park- and league-adjusted ERA. He’s been terrific, and the adjustments he’s made since last September are driving his newfound success.
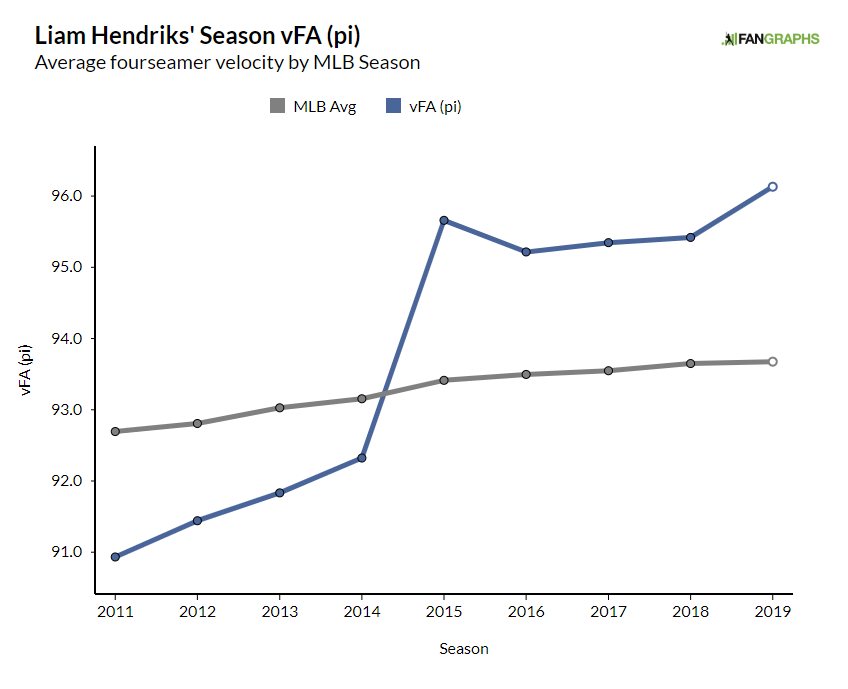
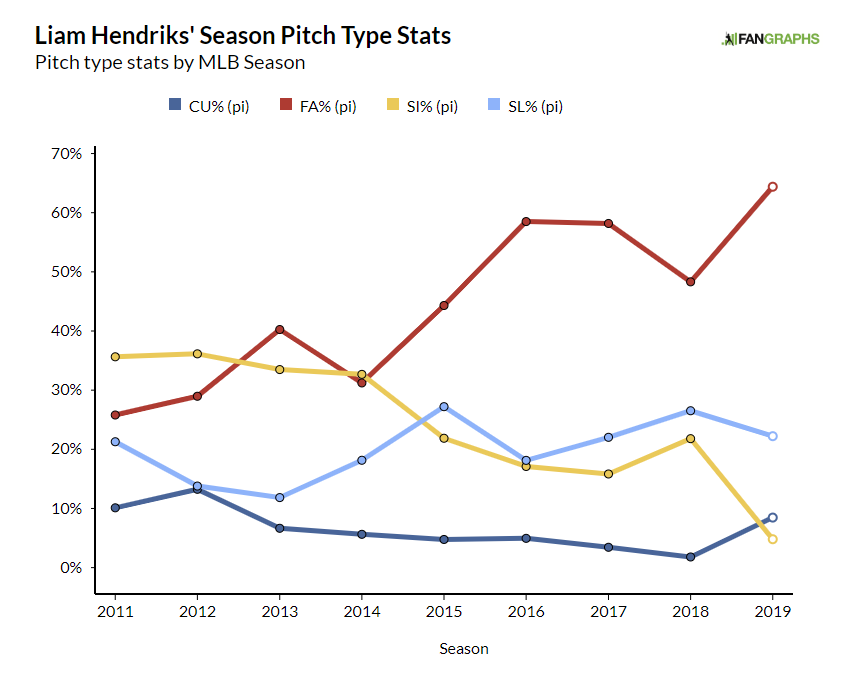
Last year, after being demoted to the minors, he changed his workout routine and began throwing long toss to increase his arm strength. The result has been the highest velocity of his career, averaging 96.2 mph and hitting 99 on the gun a few times. He’s also stopped throwing his sinker in favor of more four-seam fastballs. With the effectiveness of the sinker waning league-wide, Hendriks has leaned into the best version of his heater.
As you would expect with more four-seam fastballs, he’s locating up in the zone more often. He’s elevating 47% of his heaters, up from the 40% he’s averaged the past four seasons. The combination of added velocity and optimal location has helped him reach a career high in whiff rate on his fastball with the added bonus of generating weak fly-ball contact. Among all pitchers with at least 50 balls in play off their fastball, Hendriks’s expected wOBA on contact ranks in the 93rd percentile. That’s helped him keep the ball in the park despite a career-high fly-ball rate. He’s allowed just a single home run this year, but his minuscule home run per fly ball rate is bound to regress toward league average.
His curveball has also made a comeback into his repertoire. He’s mainly relied on a fastball-slider combination throughout his career, mixing in a few changeups and curveballs here and there. His usage of his hook really dwindled last year but it’s been a strong third option for him this season.
And like his fastball, he’s throwing his curveball harder than ever. His bender now has the sixth-highest average velocity among all curveballs thrown at least 50 times this year. But it’s not just added velocity that’s changed, his curveball looks almost completely revamped. (I’m comparing this season’s curveball to its 2017 version, since he only threw a handful last year.)
| Year | Velocity | Spin Rate | V Move | H Move |
|---|---|---|---|---|
| 2017 | 79.56 | 1901 | -4.73 | 2.61 |
| 2019 | 84.49 | 2048 | -6.17 | 1.98 |
| Change | 4.93 | 147 | 1.44 | -0.63 |
Not only is Hendriks throwing his curveball harder, he’s added about an inch and a half of drop to the pitch. That’s led to a whiff per swing rate of 50% with his bender. Opposing batters have put just three of his curveballs in play this year, one of which was the lone home run he’s allowed.
This is how he explained his success to NBC Sport’s Ben Ross in an interview a couple of days ago: “I’ve just been throwing a lot more breaking balls for strikes. The fastball looks a little bit more explosive, but when I throw my slider and curveball for strikes… I’m also using my curveball a lot more this year than I have in the past.” His assessment isn’t exactly accurate.
| Year | Zone% | CStr + SwStr |
|---|---|---|
| 2016 | 33.1% | 28.0% |
| 2017 | 27.7% | 24.0% |
| 2018 | 30.4% | 26.4% |
| 2019 | 28.3% | 29.1% |
He isn’t exactly locating his breaking balls in the zone as often, but his called strike plus swinging strike rate is higher than ever. The massive whiff rate on his curveball has definitely helped him earn all those strikes, pushing his overall strikeout rate up to a career high.
There are a few signs that what Hendriks is doing is just a flash in the pan. With the drag-less ball pushing home run rates into the stratosphere, he’s bound to give up a few more round-trippers in the second half of the season. But the adjustments to his pitch repertoire should help him maintain some of the gains he’s made this year. With Blake Treinen a shell of his 2018 self and Lou Trivino struggling to stay consistent, Hendriks is in a great position to anchor the A’s bullpen for the rest of the season.
Jake Mailhot is a contributor to FanGraphs. A long-suffering Mariners fan, he also writes about them for Lookout Landing. Follow him on BlueSky @jakemailhot.
That and an absurd 89.4% LOB% explain the majority of his “improved” performance this season. Hendriks is inducing more fly balls than ever (50.4%) and his in-field fly percentage is only modestly above his career average, but his HR/FB rate is a measly 1.7%. That explains why his xFIP is a not at all impressive 4.08. The extra 0.7 mph, ~2.5% swinging strike increase, and ~5.5% Z-Contact reduction are all signs of genuine improvement, but the rest screams massive regression incoming.
You’re right that the LOB% is likely due some regression, but it’s not completely implausible for it to remain in the upper 80% range.
The HR/FB is bound to come up as well, but there’s more to it than just looking at the IFFB%. His Soft% is also up markedly, so perhaps he’s generating more cans of corn to the OF that aren’t being picked up by the IFFB%.
xFIP isn’t impressive, but FIP is 2.10 and SIERA is 3.37. Clearly there’s some noise here and it’s hard to know which metric to trust when predicting future performance.
Anyways, you’re not wrong, but I think you’re also being hard on the guy. He is a reliever after all. They work in small samples and can outperform the peripherals in unexpected ways.
It is completely implausible. His LOBs the prior four seasons have been 78.6%, 65.5%, 70.1%, and 72.3%. Out of all major league relievers with at least two hundred innings since 2015, Raisel Iglesias has the best left on base rate at 84.0%.
One of the main flaws in FIP is that it ignores homer rate completely but research has consistently shown that while pitchers do have some control over their homer rate, it still regresses to somewhere around 10%. Ditching the sinker undoubtedly helps Hendriks, as sinkers are associated with a slightly elevated HR/FB% (when batters get a sinker in the air it tends to go a long way), but he’s extremely likely to be over 7% going forward.
You have that backwards. Small samples are precisely why relievers like Hendriks can appear to have had a breakthrough over a half or even full season when they actually haven’t changed much at all. That’s why it’s important to look at the underlying peripherals. I got downvoted for making a similar argument regarding Jose Leclerc back in March, and he has regressed in the ways that I predicted.
Is he the first Australian all-star?
Kyrie Irving
He’s the third Australian All-Star. Dave Nilsson (1999) and Grant Balfour (2013) were the previous All-Star Aussies.
Since 2015 Liam Hendricks ranks 17th in fWAR among relievers.
He’s good, and has been for a long time.