Looking for Vintage Madison Bumgarner
Madison Bumgarner’s reputation as a pitcher wasn’t burnished during the regular season. Bumgarner has been mostly very good as a starter prior to October. From 2011 through 2016, he averaged 212 innings and 3.9 WAR per year. During that time his 23.3 WAR places him ninth among major league starters, which is more a low-level ace than a dominator in the form of a Clayton Kershaw or Max Scherzer. No, it was in three postseasons that Bumgarner forged his reputation, pitching another 100 innings across three playoff seasons and three championships, including earning NLCS and World Series MVP honors in 2014. With the Giants unlikely to contend this season, Bumgarner’s value to the club more likely lies as a trade chip than a bringer of championships. After struggling the last two seasons, Bumgarner is pitching better in 2019, but whether he’s back to his old level of success remains to be seen.
We are still just seven Bumgarner starts into the season, but there is a bit of optimism. In his last start, Bumgarner threw the ball harder than he has in some time on the way to six innings of one-run ball against the Dodgers during which he struck eight against just two walks. The velocity wasn’t just encouraging, it was harder than he’s thrown in years.
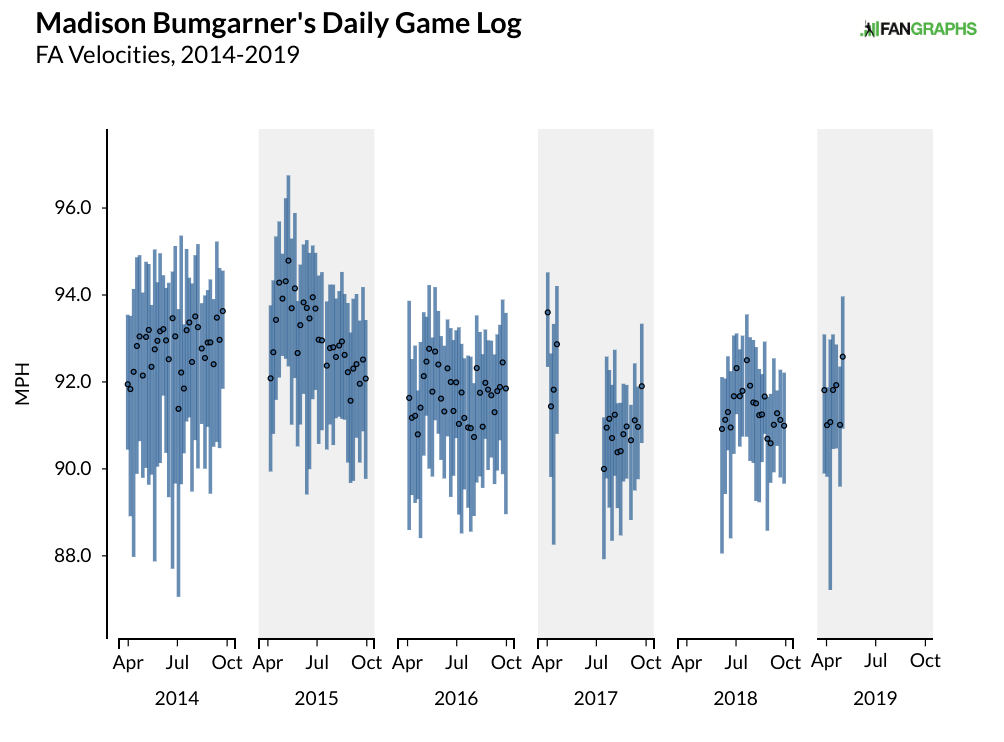
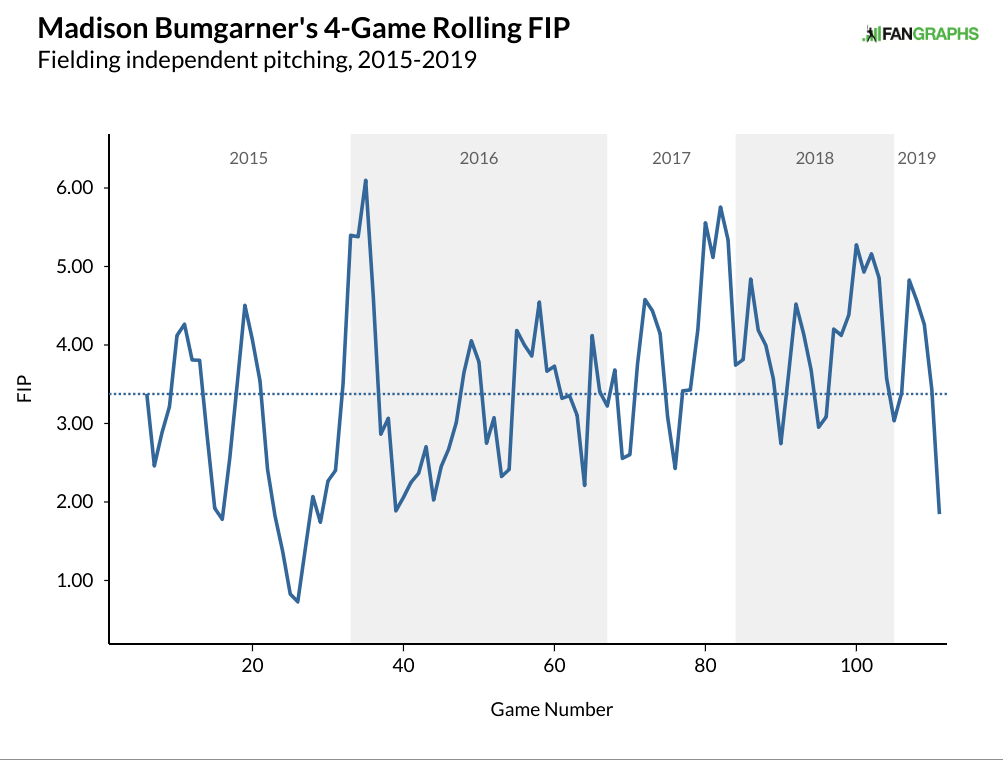
Other than a few starts in early 2017 before he was hurt, Bumgarner hasn’t thrown the ball with as much velocity as he did the other night on a regular basis since the 2015 season. And it wasn’t just the last start that Bumgarner has pitched well. While the velocity against the Dodgers was new, in his last four starts, Bumgarner has struck out 27 batters against just three walks in 24.2 innings for a 1.84 FIP. That four-game FIP is the best Bumgarner has put together since the 2015 season and nearly a full run lower than any stretch last year.
Bumgarner is pitching better than the last few seasons, but to get some idea about how much better, let’s take a baseline and compare Bumgarner over three different periods, plus the last four starts as a bonus. First, let’s look at some numbers most readers at FanGraphs should be familiar with.
| IP/Season | K% | BB% | ERA | ERA- | FIP | FIP- | WAR/200 IP | |
|---|---|---|---|---|---|---|---|---|
| 2011-2016 | 212.2 | 25.0 % | 5.7 % | 3.00 | 82 | 3.07 | 84 | 3.7 |
| 2017-2018 | 120.1 | 21.0 % | 6.3 % | 3.29 | 82 | 3.97 | 101 | 2.5 |
| 2019 | 43.2 | 24.3 % | 4.0 % | 3.92 | 95 | 3.28 | 81 | 3.7 |
| Last four starts | 24.2 | 26.5 % | 2.9 % | 4.38 | 106 | 1.84 | 46 | 8.0 |
From 2011 through 2016, Bumgarner was one of the better pitches in the game, but the last two seasons have seen his strikeout rate fall as the league’s rate has risen. The result has been roughly average for Bumgarner, though a good ERA has masked some of the decline. So far this year, that strikeout rate is up close to Bumgarner’s peak with a better walk rate. The ERA isn’t as good as it has been even the last couple of seasons, but the peripherals show a pretty strong performance, and we see Cy Young-level performance over the last four starts.
To provide a little context for the numbers above, particularly those differing ERAs, let’s add a few more stats.
| GB% | HR/FB | HR/9 | BABIP | LOB% | |
|---|---|---|---|---|---|
| 2011-2016 | 44.4 % | 9.6 % | 0.83 | .283 | 75.6 % |
| 2017-2018 | 41.8 % | 11.6 % | 1.16 | .273 | 80.3 % |
| 2019 | 37.0 % | 11.4 % | 1.03 | .300 | 60.5 % |
| Last four starts | 36.8 % | 4.5 % | 0.36 | .366 | 62.9 % |
Bumgarner’s BABIP and left-on-base percentage this season help to explain the gap between his ERA and his FIP. There’s little reason to think that the LOB% will be as low or the BABIP as high going forward. If he keeps pitching as well as he has been, that ERA is due for a fall. His home run rate on the season is in between his peak and his valley, which is more impressive given the current home run environment, though pitching in San Francisco does help. He’s going to allow more homers than he has the last four starts, but keeping the number close to one per nine innings would be a big help in preventing runs. It’s interesting that his groundball rate has continued to decline, though that has been true for pitchers overall during the last decade.
We know Bumgarner’s strikeout rate is up and his walk rate is down, but it might help to know how his plate discipline numbers have changed and whether any of those changes look similar to youngBum.
| O-Swing% | Z-Swing% | Swing% | O-Contact% | Z-Contact% | Contact% | Zone% | F Strike % | Sw Strk% | |
|---|---|---|---|---|---|---|---|---|---|
| 2011-2016 | 31.8 % | 64.6 % | 48.4 % | 57.8 % | 87.0 % | 77.5 % | 50.7 % | 63.6 % | 10.8 % |
| 2017-2018 | 32.2 % | 65.9 % | 48.5 % | 64.2 % | 88.1 % | 79.9 % | 48.4 % | 65.0 % | 9.7 % |
| 2019 | 34.1 % | 66.0 % | 50.4 % | 55.2 % | 89.3 % | 77.9 % | 50.9 % | 71.8 % | 11.1 % |
| Last four starts | 36.0 % | 69.5 % | 52.2 % | 54.6 % | 91.4 % | 78.2 % | 48.3 % | 68.6 % | 11.3 % |
Hitters are swinging at more pitches out of the zone and making contact on fewer of those swings, which wasn’t happening over the last couple years. The result has been a swinging strike rate that looks like one from his peak. Bumgarner appears to have placed a greater emphasis on getting ahead of batters, which also might help explain why batters are chasing pitches at a greater rate. Batters are making more contact in the zone, and there might be a reason for that in Bumgarner’s pitch usage.
| FA% | SL/CT% | CU% | CH% | |
|---|---|---|---|---|
| 2011-2016 | 45.8 % | 35.0 % | 13.2 % | 5.7 % |
| 2017-2018 | 38.2 % | 35.5 % | 19.3 % | 6.7 % |
| 2019 | 39.4 % | 35.6 % | 14.9 % | 10.1 % |
| Last four starts | 42.5 % | 32.6 % | 15.2 % | 9.7 % |
As other pitchers are moving away from fastball usage, Bumgarner has leaned into it lately, though the uptick over his last four starts is due mainly to throwing roughly 60% fastballs in his last start. He still throws the slider/cutter a bunch while his curveball use has dropped from what it was the last few years due to more changes. Now, back where we started, with velocity.
| vFA | vSL/CT | vCU | vCH | |
|---|---|---|---|---|
| 2011-2016 | 92.4 | 88.2 | 77.1 | 84.8 |
| 2017-2018 | 91.4 | 86.4 | 78.2 | 83.7 |
| 2019 | 91.7 | 86.3 | 78.6 | 84.4 |
| Last four starts | 92 | 86.7 | 78.7 | 84.4 |
After an accident in 2017 hurt his shoulder and ribs, and a finger injury last year robbed Bumgarner of a couple early-season months, it’s fair to wonder if Bumgarner was at full-strength the last couple years. Skepticism coming into this season for the 29-year-old was warranted. Our projections pegged Bumgarner for just two wins across 200 innings this season. That performance might not make Bumgarner much of a trade chip at all, let alone a potential anchor in the playoffs. Already, Bumgarner has caused an uptick in his projections, but not significantly so. If Bumgarner keeps pitching like he has been, he might be the biggest piece traded in July, not based on reputation, but performance. He enters tonight’s start with a 3.92 ERA, but he’s already pitching much better than that ERA indicates. If the uptick in velocity is real, we’re probably watching a Madison Bumgarner we haven’t seen in three years.
Craig Edwards can be found on twitter @craigjedwards.
Its an interesting thing; is Bum going to be the last pitcher who gets the Justin Verlander-esque “postseason premium” (hard to imagine w/ analytics-driven FO’s, but still) at the trade deadline this year? Because the odds of him being a Giant and them settling for a draft pick seem less than 0.
I am not sure that Verlander got a “postseason premium” as much as the Astros got really desperate and Verlander started to pitch better. Of course, we could see a similar thing happening this year with Bumgarner.
I’m not fully buying it. His LD and FB rates are up over last year, while his GB rate is (obviously) well down. His MED and HD hit percentages are up considerably. His velocity is just barely back to the low end of the 2016 range and well below 2015 and prior.
I don’t think his shoulder is ever going to be right again after the injury. I think we can expect modest success but nowhere near vintage MadBum.
I didn’t expect to be convinced at all … but I was convinced of at least SOME cause for optimism.
I’d like to see those same tables with his two BEST years, 2015-16, swapped in for the bulk early period of 2011-16.
In 2015 and ‘16, his K-BB% ranked 7th and 8th among those with 20 starts, while in 2011-14 he ranged from 10th to 17th. I may be splitting hairs, but to me it was the stretch run of 2014 when he became a GREAT pitcher, lasting through 2016.
I wonder the ball velocity off bats has been this season. Particularly to the 3B side.
I’d rather see pitch characteristic arguments like spin rates and movement than result-based arguments.
I know he forged his reputation in the three post seasons that the Giants won the WS, but his complete game shutout in the 2016 WC game has gotta be up there with his top postseason moments too.