Matt Barnes’ One Simple Trick
In 2018, Matt Barnes had a promising season for the Red Sox. He struck out 36.2% of the batters he faced en route to a 3.65 ERA and 2.71 FIP. His one weakness? He walked 11.7% of the batters he faced, a dangerous number. That pattern carried through to 2019; he struck out 38.6% of his opponents but walked 13.3% of them. That strikeout rate is wonderful, but the walks gave him little margin for error, as evidenced by 2020, when he struck out 30.4% of his opponents (still great) but walked 13.7% on his way to a below-replacement-level season.
In 2021, you’ll never believe it — Barnes is striking out the world again, with a 48.4% strikeout rate that’s fourth among relievers, behind only Aroldis Chapman, James Karinchak, and Josh Hader. Oh yeah — he’s also walking 4.8% of his opponents and has been quite possibly the most valuable reliever in the game. Let’s get an explanation for that, shall we?
At surface level, it’s easy! Take a look at swinging strike rate, a statistic that becomes reliable quickly:
| Year | SwStr% | K% |
|---|---|---|
| 2015 | 9.5% | 19.6% |
| 2016 | 10.8% | 24.7% |
| 2017 | 12.0% | 28.9% |
| 2018 | 14.5% | 36.2% |
| 2019 | 14.9% | 38.6% |
| 2020 | 11.3% | 30.4% |
| 2021 | 19.1% | 48.4% |
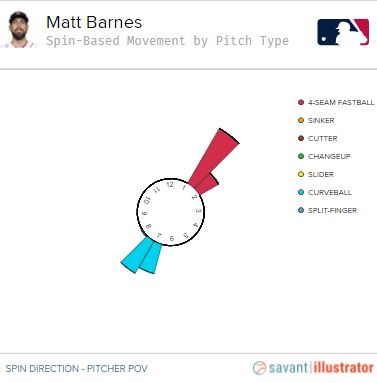
A 19.1% swinging strike rate is excellent; top-of-the-league excellent, really. Also true: Barnes hasn’t changed his pitch mix. He’s a two-pitch reliever, with a riding four-seamer and hammer curve. He throws them both roughly half the time, and they spin more or less exactly opposite out of his hand, which seems to help them both play up:
Great, problem solved. Hard curveball, decent fastball, they both play into each other’s deception, sounds like a good reliever to me. One small problem: there are maybe 50 relievers like that in baseball, and Barnes was also like that in the past, when he was far more walk-prone without his current killer strikeout numbers.
Dive into the specifics of each pitch, and the picture gets murkier. Here’s his fastball:
| Year | VMov | HMov | Velo | Spin (rpm) | Whiff/Swing% |
|---|---|---|---|---|---|
| 2015 | 8.5 | -5.0 | 95.6 | 2236 | 18.8% |
| 2016 | 8.5 | -3.7 | 97.5 | 2281 | 25.7% |
| 2017 | 9.5 | -3.6 | 95.4 | 2252 | 27.1% |
| 2018 | 8.8 | -5.4 | 96.8 | 2373 | 29.7% |
| 2019 | 9.0 | -6.0 | 96.8 | 2412 | 29.7% |
| 2020 | 8.7 | -6.3 | 95.7 | 2315 | 26.9% |
| 2021 | 9.5 | -5.9 | 96.3 | 2327 | 32.9% |
There have, no doubt, been changes. The pitch has changed shape over time; he’s throwing it with close to 100% transverse spin, and has also added some horizontal movement to it. It’s missing a few more bats, but not enough to explain his transition to unhittable.
Let’s examine the curve next:
| Year | VMov | HMov | Velo | Spin (rpm) | Whiff/Swing% |
|---|---|---|---|---|---|
| 2015 | -6.7 | 2.0 | 82.7 | 2070 | 29.3% |
| 2016 | -8.8 | 4.1 | 82.8 | 2169 | 37.0% |
| 2017 | -9.2 | 2.0 | 81.2 | 2127 | 33.8% |
| 2018 | -7.9 | 1.8 | 84.6 | 2319 | 44.6% |
| 2019 | -8.2 | 2.0 | 85.6 | 2274 | 41.3% |
| 2020 | -7.2 | 2.1 | 84.8 | 2170 | 31.7% |
| 2021 | -7.5 | 2.2 | 86.0 | 2172 | 52.1% |
It’s a little faster, but barely, and it moves mostly the same as it has since a remake in 2018. Oh yeah — it’s also suddenly making batters swing and miss at a ludicrous rate. What’s causing the increase in whiffs if the actual pitch looks mostly the same? Sounds like a great thing to investigate further.
Here’s something obvious but oft-overlooked: count has a lot to say about curveball effectiveness. Since the start of 2020, batters are swinging at 38.9% of the curveballs they see. When they’re behind in the count, that number spikes to 47.8%. At the same time, pitchers are throwing them worse pitches to hit — pitchers drop their zone rate from 41.7% to 34.1% when they get ahead. Worse pitches, more swings — the pitcher has a clear advantage.
Barnes is throwing more curveballs in favorable counts this year. To be precise, he’s thrown 35.9% of his curves while ahead in the count this year, something he hadn’t previously done since 2015, when he threw a completely different kind of pitch. His new curve is faster, which is a good way to get outs. He’s increasingly using it in counts where hitters swing. It’s not rocket science.
Everyone would do that if it were that easy, but of course, you have to get to those advantageous counts first. Here, Barnes has done something truly different. The easiest way to get ahead in the count is to throw the first pitch of a plate appearance in the strike zone. That’s over-simplified, but seriously: the first strike is huge. If you consistently get that, the game gets easier.
That sounds wrong — won’t hitters just tee off on it? Well, when pitchers throw the first pitch of an at-bat in the zone, batters sometimes swing. Here’s what happens on those swings:
| Year | Whiff% | Foul% | wOBAcon | Run Value/100 |
|---|---|---|---|---|
| 2015 | 17.2% | 40.0% | .393 | 0.32 |
| 2016 | 18.0% | 39.6% | .402 | 0.36 |
| 2017 | 19.4% | 39.5% | .402 | 0.24 |
| 2018 | 19.3% | 39.3% | .400 | 0.30 |
| 2019 | 19.4% | 39.1% | .418 | 0.63 |
| 2020 | 21.0% | 39.0% | .401 | 0.19 |
| 2021 | 21.1% | 38.9% | .400 | 0.35 |
When batters connect, they do more damage, as evidenced by the wOBAcon column (league average hovers around .370 in most years). That offsets the whiffs and fouls, such that the overall run value is slightly in the hitter’s favor. In other words, if you throw a pitch in the strike zone and the batter swings, you’re losing out on the deal.
That’s only half the equation, though. When batters don’t swing, well, it’s a celebration. The loss in expected production after a first-pitch strike is massive. It works out to roughly four runs per 100 plate appearances, 10 times better for the pitcher than a first pitch swing is bad. Unless batters are swinging over 90% of the time at strikes, the zone is the place to live on first pitches.
Unsurprisingly, batters aren’t swinging over 90% of the time. They’re swinging at 0-0 pitches in the zone 44% of the time so far this year, the highest mark since pitch tracking started in 2008. That development is a step in the right direction on the offensive side, because letting a first pitch strike fly by is disastrous, but hitters would need to swing a lot more before flooding the zone stopped making sense. Even if they did start swinging at an absurd clip, it wouldn’t approach 90%. It’s impossible to swing that often without chasing basically any pitch that comes close to the zone, and that’s a great way to get down in the count — pitchers, after all, still miss the strike zone frequently on the first pitch of an at-bat.
This isn’t a one-size-fits-all situation, of course. If you throw a particularly hittable pitch, the fact that it’s a 0-0 count won’t save you. The more hittable your pitches are, the more avoiding balls in play matters. In the aggregate, though, it’s hardly a disaster if you throw a first-pitch strike and the batter puts it in play.
One easy way to think about it is to use wOBA. As we saw in one of the tables above, wOBA on contact hovers around .400 on the first pitch of a plate appearance. With overall wOBA indexed to OBP, that’s roughly 85 points above average.
In comparison, wOBAcon on 1-2 pitches is roughly .340. It’s less damaging contact to give up. One huge caveat: pitchers are way ahead of batters on 1-2 counts, because a strikeout is fairly likely. In fact, since the beginning of 2018, batters have compiled a .226 wOBA after reaching a 1-2 count. Being behind in the count leads to worse outcomes, naturally enough. When a pitcher lets the batter put the ball in play on 1-2, they’re gifting them roughly 115 points of wOBA.
That sounds a bit like gibberish out of context, but the point is straightforward: it’s not a disaster to go from 0-0 to contact, but losing your count-based edge because the batter managed to doink one into play is awful, even though the average contact quality isn’t overwhelming. Strikeouts are simply so likely with two strikes that failing to convert is a minor disaster.
This is more about the league as a whole than Matt Barnes in particular, but he’s taken this general principle to heart so far this year. On the first pitch of a plate appearance, he’s throwing in the zone 59.7% of the time. His previous seasonal high was 55.8% in 2015, and he’s never been above 52.5% aside from that. He’s throwing far more strikes, which means he’s getting to 0-1 far more often, which means batters are facing his curveball in tough counts more often, which means… you get the idea. He’s laying it in there. Hit it if you can.
How do you throw more pitches in the strike zone? Use your fastball more, for one. More important than that is how committed you are to hitting the zone. If you tell yourself that hitting the zone is the most important thing, to the exclusion of any other first-pitch thoughts, you need to be okay with leaving one over the middle of the plate. Pitchers don’t control precisely where the ball goes 100% of the time; whatever they might say, they can’t reliably hit a precise spot. It’s a good thing, too, because hitting seems hard enough as it is.
Barnes didn’t hit the heart of the plate very often to start at-bats last year, which sounds like a positive indicator. He ventured over the heart only 11.9% of the time. This year, that number has spiked to 21%. Again, sounds bad — but if your goal is to hit the strike zone on 0-0, you have to be okay leaving some over the middle. Not everyone can be Kyle Hendricks, but they can control what happens when they inevitably miss by picking an area where missing is acceptable. Barnes is giving himself more margin for error, as evidenced by the high rate of pitches over the heart of the plate on 0-0. It’s paying off, as evidenced by the fact that he’s striking out half the batters he faces.
Is it really so simple? Probably not. Pitching is endlessly complex. This isn’t the only change he’s made this year; the pitches are shaped marginally differently, he’s using them in slightly different sequences, and he’s facing different hitters.
Real talk, though? It’s close to being that simple. Barnes has a pretty solid fastball and a wipeout, take-no-prisoners curve. The curveball works better when he can use it to bury his opponents. He made an adjustment that lets him get into that situation more often. In an unsurprising development, he’s now burying his opponents far more consistently. Now batters need to adjust — and so far, they’re adjusting by walking back to the dugout muttering to themselves.
Ben is a writer at FanGraphs. He can be found on Bluesky @benclemens.
Watching Barnes all year, surprised the change in fastball movement isn’t larger. The dude is painting though.
Great piece Ben!
Part of his success has to be outdated scouting reports. The book on him for YEARS has been to take, take, take. He’s always been a guy who walks batters rather than throw hittable strikes. He’s flipped the script this season, and I think we’re just at the point where everybody is admitting it. Hardly a hot take for FG, but I predict an immediate sharp uptick in HR and BABIP.
Exactly. The league will adjust; can he still be effective?
Ben asks’ “How do you throw more pitches in the zone?” and he answered himself “use your fastball more” but I am sure Barnes wasn’t trying to throw all those wild, high to the arm side fastballs (except for the one that almost took out Machado) that all Red Sox fans had come to accept as who he was. I probably have watched a higher percentage of Barnes pitches, since he arrived in Boston, than anyone else on this site and I keep waiting to see them but where are they? I can’t recall any pitcher ever going from a wild man to a control artist literally in an instant. Has he figured out how to keep his, always excellent, two pitches under control or is it just a temporary moment?
Interesting stuff, Ben. I also wanted to add that there was a quote from Julian McWilliams at the Boston Globe about how Barnes started throwing his fastball down the middle after talking with the Red Sox analytics folks: https://twitter.com/byJulianMack/status/1387151509037756421