Matt Wisler’s Tiny, Season-Altering Adjustment
Here’s a story that you hear all too often these days. A reliever has a breakout season, perhaps aided by leaning more into throwing his best pitch to the exclusion of everything else. He parlays that into an offseason deal, or maybe a newly-prominent role on his current team. Then the next season starts, and the bloom is off the rose. Whatever ineffable magic powered last season is simply gone.
Here’s another story you hear all too often these days. A reliever has a bad stretch, looks like he might be cooked. The Rays, though, have seen something in him. They trade for him, whisper a few sweet nothings (or, fine, mechanical adjustments) into his ear, and bam! He’s part of their bullpen army.
Here’s the fun part: Matt Wisler personifies both of these stories. He was so bad the Giants designated him for assignment after a horrid start, then agreed to a trade with the Rays. Since heading East, he’s been incredible, one of the best relievers in the game. Seriously, look at these splits:
| Team | IP | ERA | FIP | WAR |
|---|---|---|---|---|
| SFG | 19.1 | 6.05 | 4.11 | 0.0 |
| TBR | 26.1 | 2.05 | 2.15 | 1.0 |
I had to know what changed. I’ll warn you: there’s a lot of failure in this article, a lot of finding not much, before we get to the good stuff — and I promise there’s good stuff. If you’re not into seeing how a pitcher can get to wildly different results with a substantially similar process, this article might bore you. But if you’re curious like I was, read on, and delve deeply with me into the minutiae of a pitcher who didn’t change very much and yet went from unplayable to great.
When I’m looking for a change in pitching results, the first place I look is actually two places: velocity and pitch mix. These are pretty self-explanatory; if you throw harder, that often creates better results. If you feature your best pitch more, same deal. How does Wisler stack up here?
| Team | FB% | FB Velo | SL% | SL Velo |
|---|---|---|---|---|
| SFG | 9.7% | 91.6 | 90.3% | 82.2 |
| TBR | 9.4% | 91.4 | 90.6% | 81.1 |
Oh yeah. Wisler is a super weird pitcher. He’s all sliders all the time, and he hasn’t changed that. His slider speed is down a hair, but that’s never been the point of the pitch. We can safely rule out a change in pitch mix; the Rays didn’t tell him to throw his slider more, because it’s basically not possible.
Let’s pause here to look at something remarkable. At a granular swing-and-miss level (or even take-for-a-strike), you might not guess which of his two halves was more successful:
| Team | O-Swing% | Contact% | SwStr% | CStr% | CSW% |
|---|---|---|---|---|---|
| SFG | 27.4% | 62.5% | 16.5% | 21.8% | 38.3% |
| TBR | 25.5% | 72.1% | 11.9% | 21.5% | 33.4% |
Weird, huh? Wisler was downright awesome at missing bats in San Francisco, and he’s been worse in Tampa Bay. He hasn’t been bad or anything, but it’s a meaningful decrease, and more whiffs is almost universally good. It appears not to have been in this particular case, though; despite throwing a similar percentage of pitches in the strike zone and getting fewer first strikes, Wisler has upped his strikeout rate while slashing his walk rate.
Time to get down to brass tacks: have the Rays changed the shape of Wisler’s slider? That seems like it could do something. This looks promising. Per Statcast’s measures of pitch break (ignoring the effect of gravity on V-Break), Wisler is throwing the pitch with plenty more horizontal break:
| Team | H Break (in) | V Break (in) |
|---|---|---|
| SFG | 8.1 | 0.7 |
| TBR | 11.1 | -1.4 |
That looks a lot like how he threw the pitch in 2020; he averaged 11 inches of horizontal break and slight downward movement relative to gravity, just like his Rays form this year. Interestingly, the pitch is now getting more downward break despite being released at a flatter angle; 43 degrees above horizontal, as compared to 56 degrees with the Giants. He was at 47 degrees in his standout 2020 season; the Rays are getting him to throw around the ball more. In fact, he’s throwing it with less spin; he’s simply getting more of the spin to translate to movement.
It’s paying off, and for an interesting reason (in addition to the fact that more movement is generally good): getting around the ball seems to be helping Wisler with his consistency. One of the big problems with throwing a boatload of sliders is that sliders are touchy pitches. Overcook it, and you’ll end up with… well, Sonny Gray will tell you. Sliders like Wisler’s work because they dart out of the way of bats. Throw a cement mixer, and the bats won’t be afraid.
On the year, Wisler’s average slider has about 10 inches of horizontal break. I defined a backup slider as one that broke less than five inches. The results were stunning. A full 18.9% of the sliders Wisler threw while he was on the Giants backed up. That’s… yeah, that’s not good. With the Rays, it’s only 4% of the sliders he’s thrown.
Even if you’re not throwing a backup slider, you might still be throwing a slider that meets hitters’ expectations, and that’s bad too. The average slider thrown in the low 80s breaks 7.5 inches horizontally. I used some discretion and checked for sliders with between five and eight inches of break — near average but tending towards straighter — and the results were just as bad. 28.2% of the sliders he threw on the Giants fell in that band, and they cost him two runs relative to average. On the other hand, only 15% of his sliders on the Rays were in that band, and they were enough of a change of pace compared to his regular slider — nearly a foot of break — that batters did poorly against them.
Here, take a look at it in graph form:
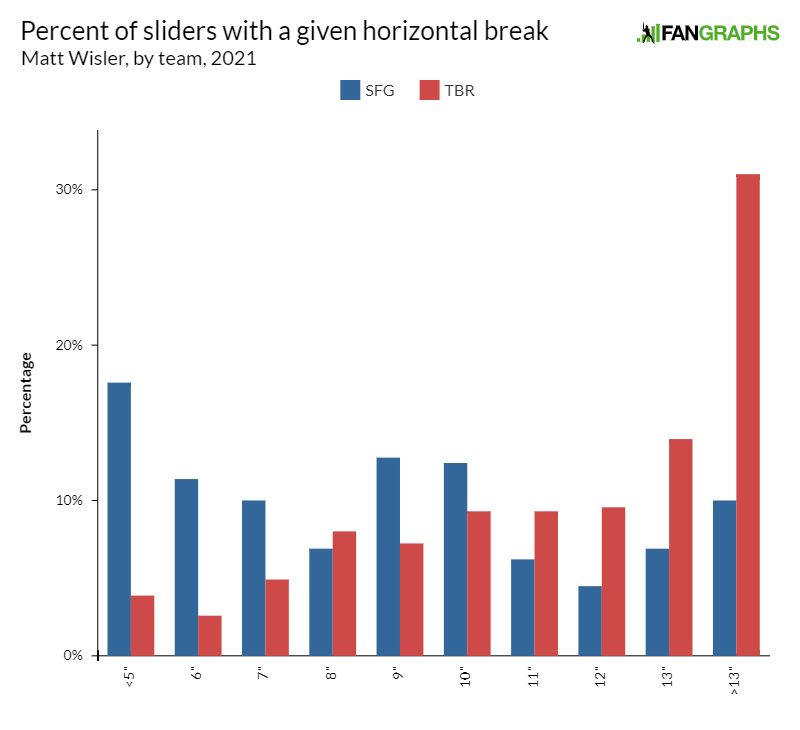
That huge right tail on his pitches with the Rays tells you what’s going on: they’ve rediscovered the shape of his slider. What’s truly remarkable about it isn’t that he’s found his old form; you could have looked at the results and assumed that. What’s amazing to me is that the change is so small. He’s lowered his release point slightly, and I do mean slightly; he’s releasing the ball roughly an inch lower and an inch further towards third base, quite close to what he did in 2020. He simply got out of his arm slot a little with the Giants, and it messed with the ball something fierce.
The weirdest part is that if you didn’t go looking for this mechanical tweak, you’d assume it was just a function of luck. In San Francisco, he ran an xFIP of 3.61. In Tampa, it’s 3.21. That’s better, sure, but both are good. The only problem is, xFIP assumes an average home run rate. If you’re throwing 80 mph pitches that don’t break, are we sure that makes sense? Statcast agrees; his barrel rate has dropped form 10% to 3.2%, his hard-hit rate from 36% to 17.7%, and he’s getting more pop-ups, exactly what his slider is designed to do.
There’s just one last problem left to solve: those baffling walks. This one is stranger. If you’ll recall from above, Wisler’s zone rate has actually declined since changing teams. Break it down, though, and you’ll see something wholly different:
| Team | Behind | Even | Ahead |
|---|---|---|---|
| SFG | 51.6% | 63.8% | 39.5% |
| TBR | 64.6% | 55.6% | 32.6% |
I’m projecting at this point, but I have a guess. When he was behind in the count in San Francisco, he didn’t really trust his slider, with good reason. That led to nibbling and a low zone rate, which pushed walks higher — he’s never been a big chase rate guy. With his slider restored, he’s less afraid of pitching in the zone, and it shows.
Why is the overall zone rate the same? Because early in counts, he was trying harder to get ahead when he was on the Giants. If you don’t want to throw a strike when behind in the count, you should try not to get behind in the count! That’s what the numbers say, and I understand the impulse behind it, as well as why he’s reversed that trend since adding back his break. That also helps his results; if you’re more unpredictable early in counts, it’s harder for batters to go up there thinking “he’s throwing me a slider in the zone and I’m going to hunt a mistake.”
Finally, there’s a Rays angle — there’s always a Rays angle. It’s hardly a bold claim that Wisler would prefer to face batters who have trouble with sliders. In San Francisco, the average batter he faced was, well, average. They’ve accumulated a -0.26 run value per 100 sliders they’ve faced this year — the league average is -0.37. Tampa Bay, on the other hand, uses him when he’s best; his opponents since joining the Rays have compiled a -0.8 run value per 100 sliders they’ve faced. Even if you exclude his own sliders from that data, it’s a meaningful edge; nearly half a run if I did my excluding right.
In a nutshell, Wisler hasn’t changed much. He’s running similar walk and strikeout numbers using similar pitches that he throws a similar share of the time. At the same time, he’s gotten way better! Resetting his release point has changed the way he approaches each at-bat and minimized the number of mistake pitches he throws. Meanwhile, Tampa Bay is putting him in a position to succeed — seems like a good idea to me! Matt Wisler looks good again, and it emphasizes how slim the margin is between an effective reliever and a 6.00 ERA.
Ben is a writer at FanGraphs. He can be found on Bluesky @benclemens.
Perfect article except for the missed opportunity for the title: “Matt Wisler Tames His Cement Mixer”
Great piece
THESE are the kind of articles I LOVE in Fangraphs. Thanks!
1) I truly appreciate the fact you looked for a biophysical reason for the effect, a not simply a baseball-outcome statistical one.
2) In helping to determine if effects are more likely to be “real” vs. “luck”, it would be appreciated if authors would include the number of measurements / samples used in any graph or table which displays percentages. We should always be cautions of “small sample size” effects.
Note, it is most useful to display N within the graph or table.
Well-researched, informative and fascinating. Great job.
Turns out Wisler’s Mother is a revamped slider nurtured by an incredible Tampa Bay analytics staff. Great article!
Perhaps there is another added dimension: C setup. Rays C set up right down the middle and don’t move. It maybe is different now, but Buster Posey often set up on corners, at least in the past. And I haven’t looked, but does framing play a role.
Nice work Tampa.
I would always be so nervous to trade with the Rays.
Also, as a Rangers fan, I wouldn’t mind them calling the Rays about any pitchers they like on the Rangers, then just trading the Rays $5million to say what their tweaks would have been if they got player X