
Mind the WAR Gap

Aaron Judge stands alone. Well, Aaron Judge usually stands alone. This year, he’s got company. Judge leads all players with 8.3 WAR. Shohei Ohtani is right behind him with 7.8 total WAR (6.5 as a hitter and 1.4 as a pitcher), and Cal Raleigh is right behind him with 7.6. With a difference of less than three-quarters of a win, that’s an extremely tight race to be baseball’s WAR leader. It got me wondering how often these races are that tight, so I hit the spreadsheets. I pulled the top three WAR-getters in each season since 1901 and checked to see whether this year’s race is an outlier, and if so, just how out there it is compared to seasons past. The short answer is yes, this race is really tight by pretty much any historical standard.
Before we get into it, I’ve got to make a couple notes on the data and methodology here. First, I used FanGraphs WAR, both because I work here and because I’m a FanGraphs fan. (I’m also a fan of FanGraphs’ graphs, which makes me FanGraphs graphs fan. I could keep going.) Ohtani leads baseball in WARP, Baseball Prospectus’ version of WAR. As Ginny Searle wrote on Wednesday over at BP, Judge leads Raleigh by much more in both Baseball Reference WAR (which doesn’t incorporate pitch framing) and WARP (because DRC+ thinks Raleigh’s deserved offensive performance is slightly below his actual performance). Still, we’re going with fWAR, or as we refer to it here at FanGraphs, WAR.
Second, no matter which version you use, you’re really not supposed to dice WAR up like this. It’s a great stat that captures a lot, but it has error bars like any stat, and there are probably bits of value players produce that we can’t measure. If you’re selecting an MVP or comparing any two players based on fractions of a win, you’re probably doing it wrong. But I double-checked, and it turns out that nobody’s going to fire me for handling WAR slightly irresponsibly. Today, we’ll have some fun doing it wrong.
Third, I combined both hitting and pitching WAR, but only when it benefitted the player in question. That is, I excluded any partial season with a negative WAR total. Back before the universal DH, we didn’t dock an NL pitcher for their performance at the plate when we assessed their contributions. When we talked about a pitcher’s WAR, we just talked about their pitching WAR; we didn’t ding them because the rules said they had to go up there to bunt and strike out a bunch of times. The same goes for a position player who had to pitch some in garbage time. So we’re only including positive contributions. If you’re a pitcher who hit well or a batter who threw a scoreless garbage time inning, you’ll get some bonus credit by this method, but you won’t get docked for being bad at something that’s barely even part of your job description. If Shohei Ohtani were to put up negative WAR on one side of the ball, that would be a different matter, but this is just what seems fairest to me.
Fourth – sorry, I’m just kidding around. There’s no fourth. Three paragraphs full of notes about the data is plenty. Let’s get to it.
As of last night, the difference between Judge and Raleigh is 0.691464424 WAR. That’s just under one-seventh of a win. If you’re keeping score at home, I hope you’ve got very, very tiny handwriting. This is a really tight race. In terms of seasons with the smallest gap between the first- and third-place WAR-getters, it ranks 30th since 1901. We’re in the 77th percentile. The average difference is 1.73 WAR, and the average standard deviation is 0.92 WAR. We’re not in outlier territory, but we’re definitely on the smaller side of the ledger:
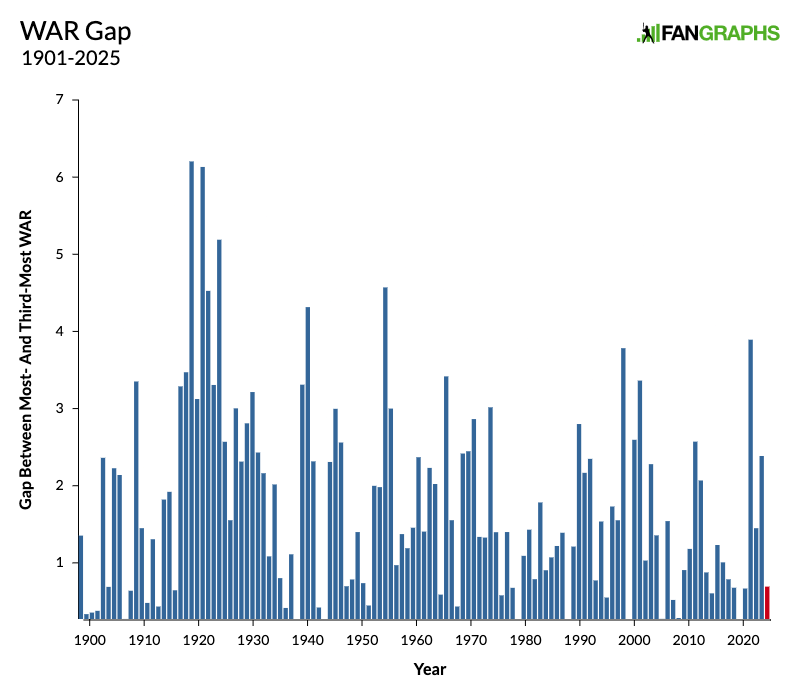
The outlier seasons belong to Babe Ruth, whose discovery of the home run in a fortuitous laboratory accident allowed him to lead the league in WAR 10 times in 13 years starting in 1919. In those 10 years, he twice led the third-place finisher by more than 6.0 WAR, and his average lead was 3.81. The three times that Ruth didn’t lead, Rogers Hornsby overtook him, and Hornsby’s average lead was 3.14 WAR. It was a different time. But even if we ignore Ruth and Hornsby and start in 1932, the average only drops to 1.56. That’s still more than twice as big as this season’s gap. By any historical standard, this is a very close race. Here’s the 10-year rolling average:
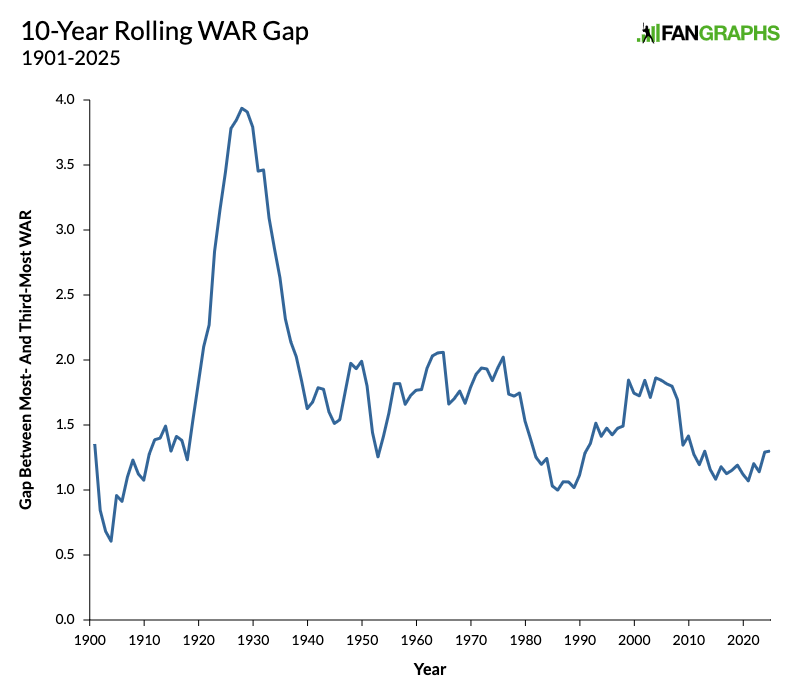
Once you get out of Ruth’s shadow, I don’t really know how to interpret this graph other than to say that there have been some ups and downs. Generally speaking, we’ve been in a trough for the past 15 years or so. However, you might notice that the numbers tick up at the very end there. That’s because of Judge. Not only is this year’s gap particularly low, it’s low for Judge in particular. He’s on pace to lead the league in WAR for the third time in four years and the fourth time in nine years. He’s one of just eight players in baseball history to lead the league four times, and his average margin over the third-place finisher is 2.0 WAR. He led by 3.9 WAR in his historic 2022 season and by 2.4 in 2024. Until this season’s close call, his average was 2.4 WAR. That’s up there with the very highest averages in the history of the game. In his WAR leader seasons, Judge has led the third-place finisher by a total of 8.0 WAR. That’s the seventh-highest total ever, between Hornsby and Honus Wagner.
In other words, this is yet another way to appreciate the fact that Judge has dominated the game of baseball like few others before him. Here is the top 10 all-time. The average lead (for players who led the league in WAR at least twice) is on the left, and total lead is on the right. The company is pretty good:
| Name | Average Lead | Count | Name | Total Lead | Count | |
|---|---|---|---|---|---|---|
| Babe Ruth | 3.8 | 10 | Babe Ruth | 38.1 | 10 | |
| Rogers Hornsby | 3.1 | 3 | Barry Bonds | 13.8 | 6 | |
| Jimmie Foxx | 2.8 | 2 | Ted Williams | 13.6 | 5 | |
| Mickey Mantle | 2.8 | 4 | Willie Mays | 12.2 | 7 | |
| Ted Williams | 2.7 | 5 | Mickey Mantle | 11.0 | 4 | |
| Carl Yastrzemski | 2.5 | 2 | Rogers Hornsby | 9.4 | 3 | |
| Barry Bonds | 2.3 | 6 | Aaron Judge | 8.0 | 4 | |
| Joe Morgan | 2.2 | 2 | Honus Wagner | 7.8 | 5 | |
| Lou Gehrig | 2.1 | 2 | Ty Cobb | 6.3 | 4 | |
| Aaron Judge | 2.0 | 4 | Mike Trout | 5.9 | 3 |
In order for two players to get close to Judge, we needed to have Ohtani playing the game like no one before him ever has and to have Raleigh challenging for the best catcher season in history. We’ve also got to have Judge dealing with a flexor strain that cost him an IL stint, and that is still costing him WAR by way of limiting his ability to throw and forcing him to DH at times.
Before we wrap up, I have to acknowledge that this article would’ve looked a whole lot different if it had run yesterday. Here’s how the conclusion started in yesterday’s draft:
There’s no guarantee that things will stay this close. These numbers will have already changed by the time this article runs. Judge could launch three homers and push the lead up by more. Regardless, these three players have been this close for a while, and October is getting awfully big in the window. This really is notable.
Well, Judge hit a measly two homers last night. Before he did, the difference between him and Raleigh was just 0.364966393 WAR, the 12th-lowest of all-time. That’s the 91st percentile. This really is a fluid situation. In one day, it can go from historical outlier to “it really is notable, I swear.” If Judge ends on the kind of hot streak that only he can put up, this whole article will be moot. If Raleigh rekindles the magic of the first several months of the season, we could end up back in outlier territory. Regardless, the WAR leader race has been tight all season, and it’s another fun thing to watch for down the stretch.
Davy Andrews is a Brooklyn-based musician and a writer at FanGraphs. He can be found on Bluesky @davyandrewsdavy.bsky.social.
If you use RA/9 fWAR, Paul Skenes sits at 7.8, second in baseball behind Judge. I can’t remember the last time any pitcher was that close to to leading the league in any respectable win value stat this late into the season.
By FIP fWAR, 2021 had Ohtani, Burnes, and Wheeler all within 0.7 WAR of each other. MLB WAR Leaderboards 2021 | FanGraphs Baseball
Your comment made me look back to 2014, when Clayton Kershaw won the CYA and NL MVP with 8.3 RA/9 fWAR, beating the top 2 NL position players in fWAR, who were both catchers! (Posey and Lucroy at 7.5/7.4, respectively). Side note: When was the last time the two highest position player WAR accumulators in a league were both catchers? Wow.
Mike Trout had 8.3 fWAR and won the AL MVP. It was a simpler time. It was a better time.
Not a great year for dudes who stand behind the pitching rubber, huh
Used to love Lucroy until I saw him on Twitter. Always shocks me a guy can be so good and also just be wrong about everything baseball related
Jonathan Lucroy puts me in a mind of other Brewers who popped off for 2-3 big years and otherwise were never quite the same – Jeff Cirillo! John Jaha! Bill Hall!
Geoff Jenkins
I guess that makes me a FanGraphs graphs fan’s graph fan
Say that 5 times really fast!
Can we get a graph of FanGraphs graphs fans’ graph fans?
I’d be a fan of that.
I’d buy that tshirt
Only if it was a Graphic tee?
I still prefer to average things out between the different systems. aWAR always seems to pass my own personal smell test. When the gaps are very small, I look to WPA and RE24 to see if there is any separation. They make good tie breakers.
caught in filter, will try again, can delete this if you want
I don’t know how I feel about this line either:
You’re not exactly wrong, but if there’s error in WAR on both players how do you know that error would narrow the gap and not increase it?
And this is especially true since different components of WAR have very different amounts of error. wRC+ doesn’t have much in the way of error. Positional adjustments do. Defense does. Framing really does. Raleigh’s defensive value comes mostly from the positional adjustment and his framing. There’s a real chance that he’s lower than what his WAR says.
My preferred solution is to think through what the sources of error are likely to be and whether they are likely to close the WAR gap or increase them. And often, there’s not enough information about those to indicate that the WAR gap would be closed, or that it would be in the other direction.
I don’t disagree philosophically, but once you start adding your judgement in, you’re adding in a lot of bias. For example, how are you determining whether something would close the gap or widen it? I would probably look at YoY regression to the mean, but that’s a biased call that honestly isn’t any better than another approach.
My approach is to look at multiple things at the same time, not try to adjust one (relatively objective) metric with my biases.
There are two sources of error that are very likely and I am pretty sure I know what direction they run in.
1) Positional adjustments are simply too big. They are remnants of a time when teams were far more likely to move bigger bodied athletes down the defensive spectrum. Today’s shortstops were yesterday’s third basemen, and today’s third basemen are yesterday’s first basemen. Modern training regimens have helped a lot, and what this means is that it’s really not easy to find a bunch of mashers to stick in the corner outfield and first base (and DH, which there are a lot more of as well).
2) OAA is the best defensive system we have had ever and I am very confident it is directionally correct based on the methodology but there is something weird about the scale of it in WAR. Nick Allen is slashing .221 / .284 / .249 (not a typo!) and somehow has been worth almost a full run above replacement. He is a good defender but the idea that his defense is so good relative to the expectations at shortstop that he can be a positive contributor with that batting line is hard to believe. And there are all kinds of other examples of players where OAA gives implausible defensive numbers.
(Note that this is also even worse for DRS and DRS also has the downside of simply being in the wrong direction much more often).
I think it’s completely justified to scale down the defensive contribution to WAR and the positional adjustments. Not ad hoc, but for everyone—like, take 20% off of everyone’s OAA before it goes into the WAR machine, both positive and negative. That’s what I mean.
>how do you know that error would narrow the gap and not increase it?
You dont, hence why its error. Using your own judgement does not make that better, it almost certainly makes it much worse.
>There’s a real chance that he’s lower than what his WAR says.
There is a real chance that ALL of them are lower than what their WAR says. WAR is what it is: a distillation of a lot of assumptions into a single, easy to digest number. There will always be error bars, but introduction of bias into the sample, no matter how well intentioned, destroys the premises on which the foundation is built.
I agree that ignoring high error bars isn’t wrong.
2 +/- 42 is still better than 1 +/- 42
We have very little confidence in it but if that’s the best we can do it’s what I’d go with.
Ignoring it completely means 2=0 and 1=0. There’s a tiny chance 2>1 but no chance 2=1=0
Normally I’d agree with you here but Raleigh’s defensive component in his WAR calculation is at a 4 year low. I’d be much more inclined to discount his WAR if we were seeing a large spike in defensive value driving the overall calculation.
The second-half that Witt has been having, he’s starting to sneak up around the outside, only a little bit behind Raleigh now.
Also, I’m pretty sure that mini-bump in the rolling average around the late 90’s-early aughts is mostly Barry Bonds.
I was also seeing a Ted Williams spike in the 40’s and Mantle in the 50’s.
Regarding Ohtani, I really don’t see how his pitching is worth 1.4 wins. FWIW, bWAR has him at only 0.4, but that discrepancy aside, there seems to be a disconnect between the innings and context. After all, Ohtani’s 36 innings have been thrown at times when his presence in the game was most aligned to the Dodgers attempt to win a game. By effectively being an opener for 12 starts, and requiring the Dodgers to employ a six man rotation, Ohtani has put LA in a precarious position. You just can’t ignore the cost the Dodgers have incurred to slowly rehab Ohtani.
Now, one could argue that the Dodgers are gradually building Ohtani into a postseason weapon, and that very well may be true. But, that doesn’t mean he has been a valuable pitcher in the regular season.
Ohtani hits and pitches but only takes up 1 roster spot. Also, 2-way players don’t count against the limit of 13 pitchers.
So Ohtani has in no way hurt the Dodgers by slow-rolling his rehab. He’s a bonus. There’s good reason to believe that WAR undersells his contributions.
That slow-rolling isn’t entirely on Ohtani either. It’s mostly on ownership wanting to protect their big investment (understandable), the Dodgers starting the season with 124 SP options (understandable) and Dave Roberts not knowing how to manage a staff and not believing in Shohei as a two-way weapon (Meanwhile, Conforto steps in and I go run face first into a wall).
If it were up to Ohtani, he’d probably be at 3x the innings by now.
I don’t doubt that, but when assessing Ohtani’s contribution to the team, it really doesn’t matter.
Not contribution but it does when assessing cost to the team. It matters when you’re accusing him of putting the Dodgers in a precarious position, as opposed to saying the Dodgers put themselves in a precarious position. Or saying Dave Roberts put them in a precarious position.
The number of roster spots he takes up is irrelevant because of the context you have ignored.
As a DH, Ohtani prevents other players from being able to rotate into that position. Could Betts, Freeman, etc. use some regular half days off in the DH slot? Perhaps, but they can’t with Ohtani filling the role. Also, if Ohtani could play the OF, instead of giving 500 PAs to Conforto, the Dodgers would have more options with their lineup.
As a pitcher, Ohtani requires a sixth starter, so any roster advantage is ceded off the bat. Then, with him basically undergoing a major league rehab, the Dodgers need a deeper bullpen to eat up the 6 or so innings required in his starts.
Under no reasonable interpretation could Ohtani pitching in the 2025 regular season be viewed as anything but a burden to the Dodgers. Again, it may be a cost they are willing to pay because of the postseason reward, but in an MVP conversation, that should absolutely be held against him,
They don’t use anyone else in the DH slot because no one else hits as well as Ohtani does. Why would you sit him? If other guys need rest, well then ride the pine and be ready to PH or be a late fielding replacement.
So, the team should be designed around Ohtani instead of maximizing value? If Ohtani playing the OF meant benching Conforto, for example, LA would be better. The question isn’t is there a better DH than Ohtani, but rather, if Ohtani played the field, could the worst hitter on the team be replaced.
Having the team designed around Ohtani DOES maximize the value!!!
Ohtani has contributed 36 innings of 2.17 FIP ball and you state “Under no reasonable interpretation could Ohtani pitching…be viewed as anything but a burden to the Dodgers.” That’s simply imbecilic.
Those 36 innings have taken place over 12 starts and required the Dodgers to tax their bullpen, go to a six man rotation and regularly skip his starts at the last minute. So, yes, there is no reasonable way to argue that the circumstances under which he has taken the mound haven’t severely mitigated or even completely erased the value of those 36 innings thrown to a 3.75 ERA (FIP isn’t relevant for judging past performance as much as the potential for future performance).
The Dodgers were taxing their bullpen without Ohtani pitching. I really think the Dodgers view a 6 man rotation with Ohtani being built up very much as a feature rather than a bug. They seemed happy enough to run with bullpen games earlier in the season – and now the pitching staff is healthier, they do have 6 legitimate starters (and Wrobleski who can pitch multiple innings after Ohtani).
I do wonder if they could make an Ohtani/Kershaw start work – 4IP Ohtani, 4IP Kershaw, and then which ever high leverage reliever actually looks like they aren’t pitching batting practice that day.
Dude, you are really just grasping at straws here.
The whole DH argument is just thinking out loud without really thinking about it. The teams that accumulate the best performance from DH have a dedicated DH and do not use it as a rotating spot to get guys a rest day. The top 6 guys in PA as a DH (with team rank by WAR as a DH) are Ohtani (1), Schwarber (2), Devers (8 and 12 but it’s obviously complicated since he was traded), Rooker (7), Ozuna (14), Yelich (5). Assuming Devers’ cumulative team is really 3rd (since his WAR as a DH is 3rd), that means 5 of the top 7 teams by DH WAR are dedicated DHs.
There are only 3 other guys that have a shot at the qualifying limit of 502 PA as a DH this year (with team ranks) – McCutcheon (20), Yandy (6), Suzuki (18).
The only team in the top 7 in DH WAR that didn’t have a regular guy is the Yankees who come with all sorts of asterisks and rolled out Rice (only playing because Stanton was hurt), Stanton (hurt) and Judge (hurt and could hit but couldn’t play the field) as their DHs and in a perfect world, that was probably just going to be Stanton with Rice doing a little platoon work there.
I was going to prepare a chart showing the guy for each team with the most PA as a DH and the teams’ rank, but it is just so incredibly obvious that using the DH spot as a resting spot for your regulars just doesn’t work. Take a look at:
So saying Ohtani is hurting the team because he hogs all the DH PA is just nonsense. He’s the 2nd or 3rd best hitter in baseball and never misses games. You NEVER hurt the team by running out the 2nd best hitter in baseball every day, even if it means you can’t give Betts or Freeman a day off of fielding because of it.
Dude, you completely missed the point. The DH only came up as a counter to the idea that Ohtani has value because he “saves a roster spot”. In reality, Ohtani brings with him a six starter handcuff that offsets the roster advantage, and that’s before considering what other roster limitations the Dodgers face by virtue of his being a DH.
That aside, at no point did I argue that the Dodgers, or any team, would inherently be better off having a rotating DH. Having said that, Ohtani is a special case because Ohtani can play the field, and probably do it very well. The reason he DHs is so he can pitch. That’s why the impact of his DHing on the Dodgers needs to be considered along side the assessment of his contribution as a pitcher.
Put more simply: is Ohtani throwing 36 low leverage innings over 12 games, which requires the Dodgers to plan for a six man rotation and structure their bullpen in such a way as to cover his short outings, worth Ohtani not playing the field, not stealing 50+ bases and the Dodgers not being able to put their nine best hitters in the lineup more consistently (i.e., no Conforto)?
I think the answer is obviously no, unless the whole point of the regular season is to prime Ohtani for the postseason. If so, kudos to the Dodgers on their long-term thinking. However, that argues against Ohtani as an MVP.
In the parentheses in your second paragraph you say you can keep going. Prove it.
You say one-seventh but I believe you mean 7/10ths. (.14 vs .7)
And then Judge hit 2 more HR over the weekend and is now off to face the Twins, so, I think that Judge Hot Streak is here.
“you’re really not supposed to dice WAR up like this.”
I’m trying to square up this statement with WAR in this article being listed to nine decimal places.