MLB All-Star Game Rosters by the Numbers
One of the effects of the top-heavy American League and the middle-heavy National League was the NL posting a 158-142 record in interleague play last season. While the AL took the All-Star Game in extra innings and the Boston Red Sox won the World Series, the NL won more regular season games. We don’t yet know how this year’s All-Star Game or World Series will play out, but the NL has again taken a healthy lead when it comes to interleague play with an 83-65 record through games on July 1. Last year, the AL appeared to have the edge on paper when it came to the All-Star Game rosters, but the teams seem evenly matched this season.
The graph below shows all position players named to the initial All-Star Game rosters through play on July 6.
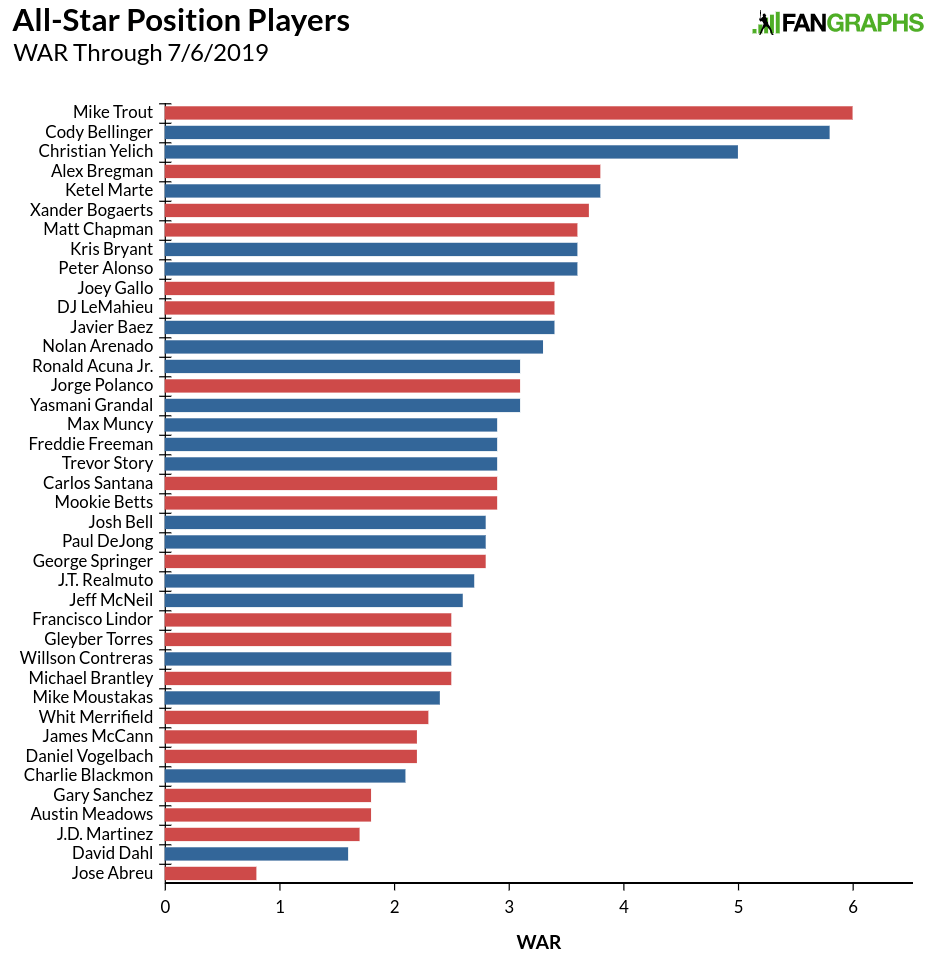
The National League has three of the top five spots with Mike Trout and Alex Bregman representing the AL. After Trout, the NL is represented by 12 of the next 17 players. The American League does have some pretty big names with better track records near the bottom of the graph like Mookie Betts, Whit Merrifield, Francisco Lindor, and J.D. Martinez, those players have yet to put everything together this season. The NL has a roughly seven-win advantage at 62.9 to 55.9, which amounts to roughly a third of a win per player. As Devan Fink noted last week, the All-Star starters by WAR weren’t too far off from the actual results, and Xander Bogaerts‘ late inclusion means the top nine players by first-half WAR made the team. Of the top-30 position players by WAR, only Marcus Semien, Max Kepler, Rafael Devers, Yoan Moncada, and Eduardo Escobar failed to make the rosters.
Looking solely at half a season’s worth of games isn’t necessarily the best indicator of talent. One could argue that the best measure of how good a player is right now might be that player’s projections over the course of the rest of the season. Here are those projections in graph form.
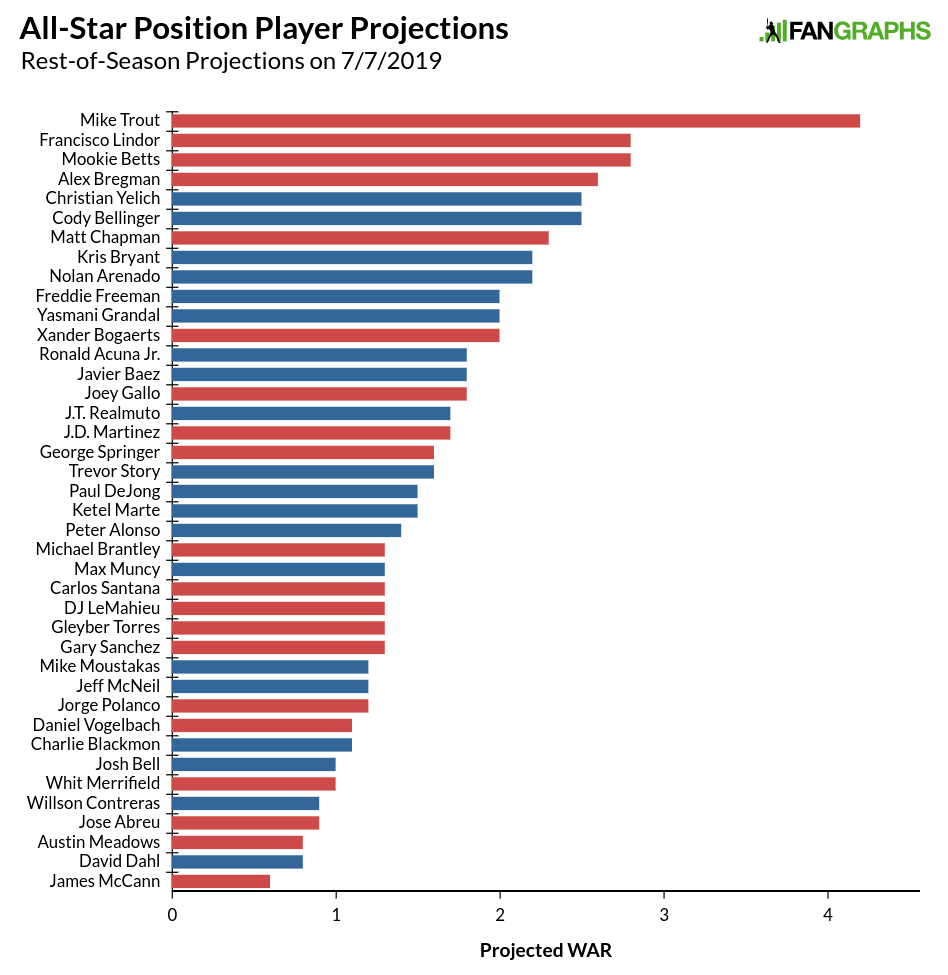
That Mike Trout is something else. His 4.2 projection for the second half of the season is far and away ahead of everyone else. His half-season projection would have placed him among the top 30 preseason projections. Put another way, if Mike Trout only played in every other game, he would still be All-Star worthy. We see Betts and Lindor’s talent level rise near the top of the graph above, and the NL can’t quite recover. Before roster changes, the NL had the advantage, but taking away Anthony Rendon from the NL and replacing Hunter Pence in the AL shifted the projections toward the AL with a 33.9 to 32.2 WAR advantage. Even with Trout, the AL still trails the NL in projected WAR, 34.9 to 33.7.
This how the position player side of the rosters break down.
| WAR | ROS Projections | Total | |
|---|---|---|---|
| NL | 62.9 | 32.2 | 95.1 |
| AL | 55.9 | 33.9 | 89.8 |
| Difference | 7.0 | -1.7 | 5.3 |
On the pitching side, the AL is bringing two more relievers than the NL, so in total WAR, the NL has a built-in advantage given the innings starters can pile up, though removing Max Scherzer leaves a pretty big dent in the NL squad’s top of the rotation.
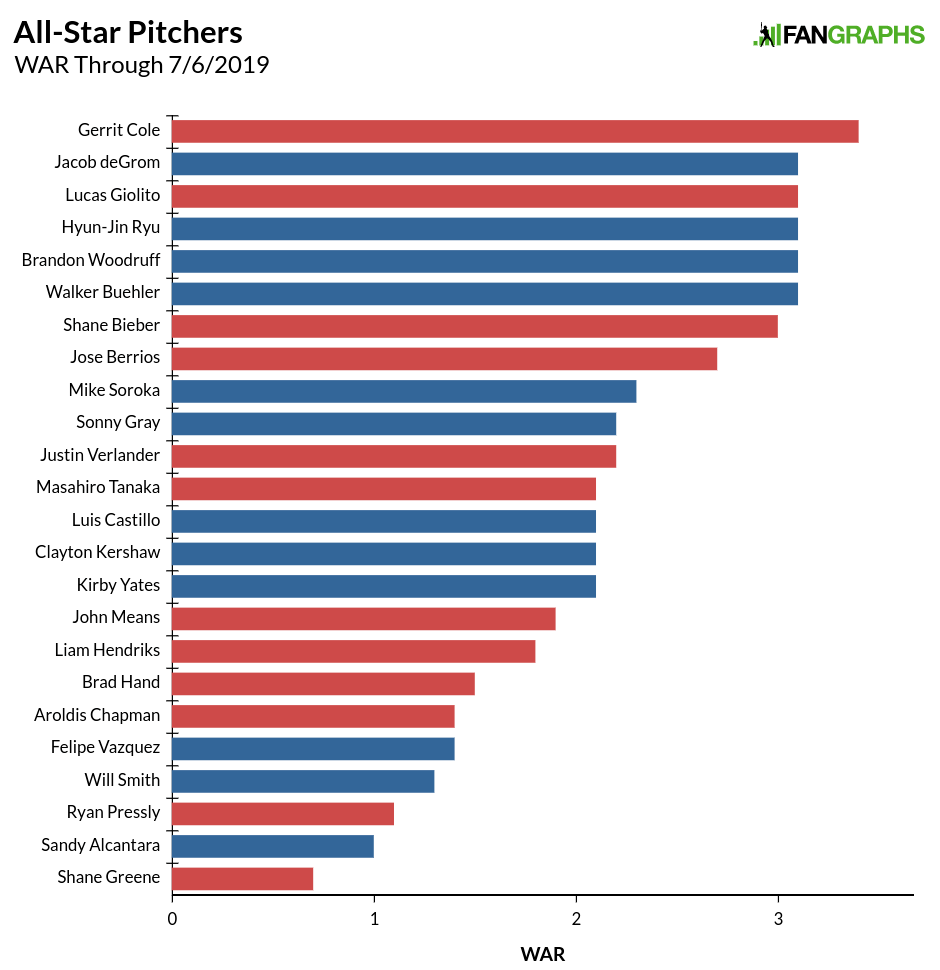
The NL tops the AL 26.9 to 24.9, with the additional starters tipping things to the senior circuit. Given ERA’s relative prominence, we might expect a few more missing players from our WAR leaderboards in the midsummer classic, though we still have a pretty good representation based on WAR. Lance Lynn, the AL’s WAR leader, did not make the squad. The only other pitcher in the top 12 not to make the roster at some point in this process was Stephen Strasburg. In the top 20, Frankie Montas, who is suspended, didn’t make the team for obvious reasons, while Matthew Boyd, Chris Sale, Zack Wheeler, and German Marquez also failed to make the team. Several players in the bottom half of the graph above were their respective team’s lone representative, indicating that some of the choices are more roster filler than picking the most deserving players.
As for the projections, even without Scherzer, the NL still has the top projected pitcher in Jacob deGrom.
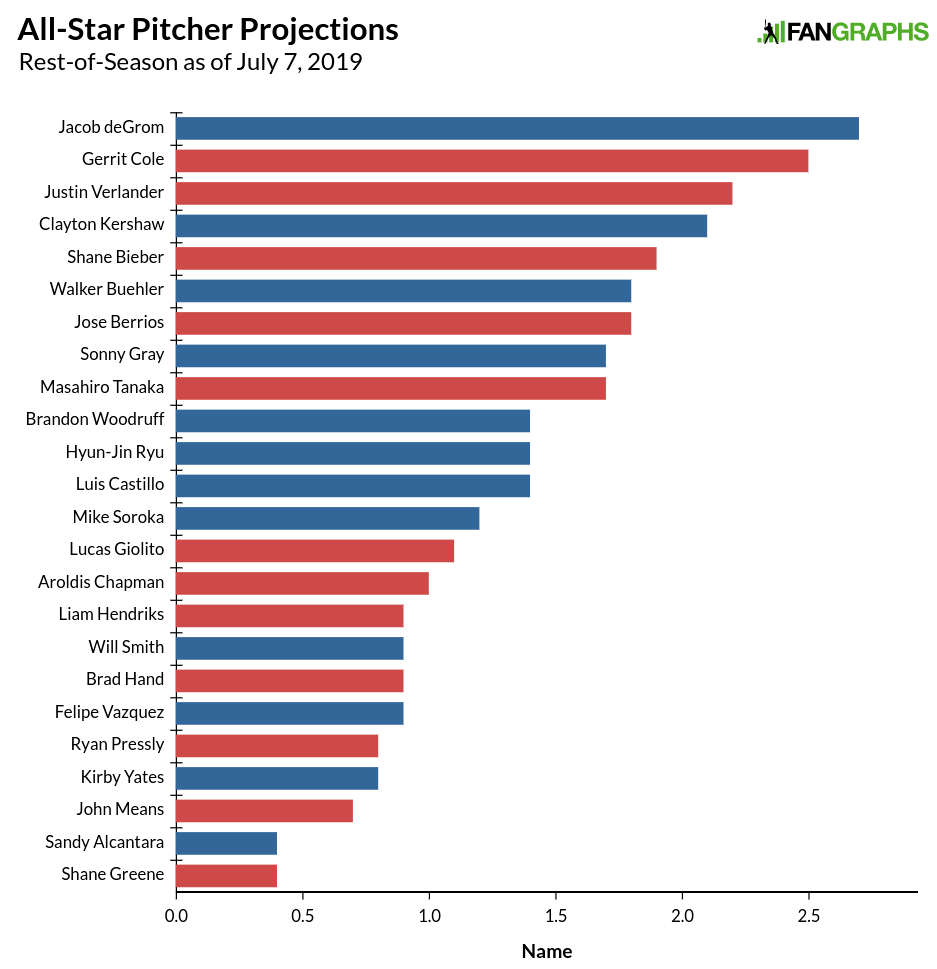
Without Scherzer, a sizable NL advantage shrinks down to less than a win. All of the relievers near the bottom along with Baltimore’s John Means and Miami’s Sandy Alcantara help create the NL’s small advantage due to fewer relievers. In terms of projections, Chris Sale is the big name missing. In comparing the pitching staffs, the leagues look like this:
| WAR | ROS Projections | Total | |
|---|---|---|---|
| NL | 26.9 | 16.7 | 43.6 |
| AL | 24.9 | 15.9 | 40.8 |
| Difference | 2.0 | 0.8 | 2.8 |
When we put it all together, the NL has the advantage in performance so far this season, but the projections are nearly identical.
| AL | NL | Difference | |
|---|---|---|---|
| Position Player WAR | 55.9 | 62.9 | 7.0 |
| Pitching WAR | 24.9 | 26.9 | 2.0 |
| TOTAL | 80.8 | 89.8 | 9.0 |
| Position Player Proj. WAR | 33.9 | 32.2 | -1.7 |
| Pitching Proj. WAR | 15.9 | 16.7 | 0.8 |
| TOTAL | 49.8 | 48.9 | -0.9 |
Before the injury replacements, the NL’s advantage was sizable. Losing the two Nationals’ stars in Rendon and Scherzer was a pretty big blow and essentially leveled the playing field in terms of talent. At the end of the year, the NL squad is likely to outproduce their AL foes. As for how much this advantage will actually matter in the All-Star Game, it probably won’t. It is a one-game exhibition and the game isn’t played repeatedly over the course of a season. With similar projections, the leagues looked pretty balanced. The American League has won the last six All-Star Games, but that history isn’t likely to matter for this year’s contest.
Craig Edwards can be found on twitter @craigjedwards.
Uh, if Frankie Lindor hasn’t “put it together”, given the numbers he’s put up after losing a third of the season, what exactly is his peak?
Given his age, body type, and skill set, Lindor would be expected to be at his peak right now. Other than baserunning (ankle injury!) his numbers are a mirror of the past two years.
What we see is what he is, which is pretty darn good.
Beyond that: Shane Bieber – 3 WAR.
First full season.
Interrrestink…