More Data About Sliders
Last week, I laid out some broad categorizations of what makes a slider effective, when viewed in the aggregate. As a quick recap: The most important single characteristic is hitting the corners of the strike zone. If you have a slider with plus horizontal movement, it’s also okay to miss over the middle of the plate. The middle of the plate is a great location early, but a poor location late in counts. There’s more, but those were the key findings.
That analysis left some additional factors out, because there are only so many tables you can fit into an article before it all starts to look the same. Additionally, some of those factors are beyond the scope of this analysis. Sequencing and tunneling, for example, are too complex to reduce to a two-dimensional grid. Deception might be even more confusing; I’d struggle to quantify it at all, let alone simplify it into a few buckets for analysis.
Today, I’d like to look at the rest of the factors I found easy to quantify and analyze. First, let’s talk about pitch movement. Last week, I looked at horizontal movement, because that’s the classic action we associate with a slider. It’s not the only type that pitchers throw, however. Sliders are such a broad category of pitch that they encompass pitches that mostly break sideways, mostly break down (at least, relative to a fastball), or have some mixture of the two.
In similar fashion to what I did last week, let’s first isolate vertical break as a component. I separated vertical movement (excluding gravity) into four quartiles, then took each group’s run value:
| Vertical Movement | Run Value/100 |
|---|---|
| 4.5″+ | -0.51 |
| 1.5–4.5″ | -0.15 |
| -1.4–1.5″ | -0.31 |
| <-1.4″ | -0.10 |
One thing jumps out: These splits sure do look weird! Sliders with positive vertical break? Sliders with a ton of positive vertical break? Here we were setting out to look for whether sharp, downward-breaking sliders do well, and the average slider actually has marginal positive break (again, excluding gravity).
Part of this is because baseball is wild. Here, meet Tyler Rogers:
Rogers throws a slider. He throws it quite a bit, in fact: 36.5% of the time in his career. He also throws from a wholly unreasonable angle, firing the ball from the general vicinity of his shoelaces. The normal action that everyone gets on their slider is roughly the same for him relative to his hand, but his hand is upside down — hence, positive vertical break.
Even excluding Rodgers, however, sliders aren’t uniformly downward-breaking pitches. Just as frequently, they have cutter-esque action: some arm-side break combined with slight rise relative to gravity. That strange fact aside, this is a boring finding. There’s not much signal in slider vertical movement, in the aggregate at least.
Similar to last week, let’s cut the data up by attack zone. As a quick refresher, here are those zones:
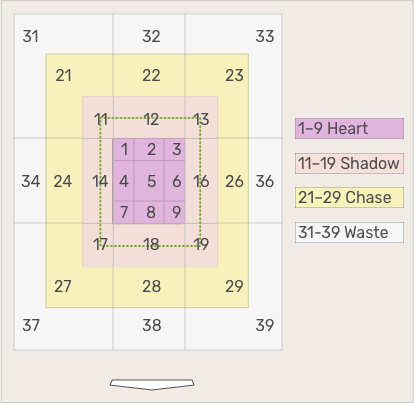
With that out of the way, here are the pitch values for each combination of zone and vertical break:
| VMov/Location | Heart | Shadow | Chase | Waste |
|---|---|---|---|---|
| 4.5″+ | -1.23 | -2.92 | 2.02 | 5.07 |
| 1.5–4.5″ | -0.75 | -2.69 | 0.60 | 4.83 |
| -1.4–1.5″ | -1.02 | -2.15 | 0.28 | 4.45 |
| <-1.4″ | 0.05 | -2.22 | 0.55 | 3.86 |
The two extremes — pitches with the most ride or most drop — seem to be useful in opposite ways. Pitches with rise (excluding gravity; the last time I’ll mention that) are the best performers in and around the strike zone. Outside the zone, however, they’re the worst performers. If I had to guess, I’d say that this is because pitchers tend to aim sliders at the bottom of the zone. To miss the zone low on a pitch that has ride, the initial trajectory needs to be extremely low — an easy pitch to take.
Meanwhile, pitches with drop aren’t great in the zone; they’re the worst relative performers over the heart of the plate, and the only subset that has a positive value (for hitters) in that zone. On the other hand, they’re the least disastrous when thrown in the waste zone. It’s likely for the same reason as above, only backwards: Pitches that drop the most have the best chance of fooling the hitter into swinging at a bad pitch, due to a higher initial trajectory.
Next, let’s put horizontal and vertical break together. This one’s somewhat confusing in that it’s location-agnostic, but for the sake of completeness, take a look:
| VMov/HMov | <2.5″ | 2.5-4.8″ | 4.9-7.7″ | 7.8″+ |
|---|---|---|---|---|
| 4.5″+ | -0.07 | -0.22 | -1.29 | -0.76 |
| 1.5–4.5″ | 0.21 | -0.71 | 0.23 | -0.54 |
| -1.4–1.5″ | 0.28 | -0.26 | 0.12 | -1.18 |
| <-1.4″ | -0.74 | -0.37 | 0.97 | -0.23 |
I have only one main take here: Sliders with little horizontal movement, what we might consider back-up sliders, score poorly unless they have significant negative vertical movement. In other words, if you don’t give the pitch enough movement sideways, the ride can be a liability, keeping the ball in harm’s way long enough for hitters to get to it. Add more horizontal break, and it’s less important (and perhaps outright bad) to get the ball down.
I think you can probably see why I excluded vertical break from my initial article; it’s more confusing than anything. That’s the downside of this two-dimensional analysis. If there are other factors that occur disproportionately in one bucket or another — if riding sliders are disproportionately slow, or hard-breaking sliders are disproportionately thrown in more advantageous counts, or anything of that nature — the conclusions won’t make any sense.
That said, there’s one more variable I wanted to look at: velocity differential. An 85-mph slider looks quite different when it’s playing off a fastball that touches 100 than it does when Zack Greinke is throwing it. I went with a straightforward methodology here, taking the average fastball velocity (two-seamers and four-seamers only, because cutters are another can of worms) of each pitcher who threw at least one slider in 2020 or ’21 and then subtracting each slider’s velocity from the relevant pitcher’s average fastball velo.
There are a few issues with this that I’m simply not going to deal with in today’s article. First, pitchers don’t have the same average velocity every pitch or every day, so comparing to their average could be missing something. Second, I’m not considering sequencing; velocity differential might not matter on the first pitch of an at-bat, or on the third consecutive slider a pitcher throws.
Anyway, though, here’s the data. The average slider checks in 8.9 mph slower than its hurler’s average fastball. There were sliders faster than the pitcher’s average fastball, sliders 22 mph slower… the data was all over the place. Broken down, however, it looks like this:
| Velo Differential | Run Value/100 |
|---|---|
| <7 mph | 0.05 |
| 7–8.8 mph | -0.83 |
| 8.8–10.8 mph | -0.11 |
| >10.8mph | -0.18 |
Great, more nothing. That second band appears to be the best, but why? We can guess at it, but nothing seems innately better about a particular velocity gap to me. Instead, let’s cross it with location to see if we can start to get somewhere:
| Velo Diff/Location | Heart | Shadow | Chase | Waste |
|---|---|---|---|---|
| <7 mph | 0.27 | -2.67 | 0.82 | 4.99 |
| 7–8.8 mph | -1.49 | -3.15 | 0.46 | 4.05 |
| 8.8–10.8 mph | -0.50 | -2.22 | 0.57 | 4.44 |
| >10.8mph | -1.13 | -2.13 | 1.52 | 4.59 |
Amazingly, the band between 7 and 8.8 is the best in every region. That doesn’t match anything we’ve seen so far; in each of our other looks, every type of slider has had a tradeoff. Above-average horizontal movement is great in the strike zone but disappointing outside of it. Positive vertical movement works the same way. Sharp negative movement is the opposite; it’s relatively (but only relatively) better when it misses outside the zone low.
In contrast, one speed of slider seems best. Here, look at velocity differential crossed with horizontal movement:
| Velo Diff/HMov | <2.5″ | 2.5-4.8″ | 4.9-7.7″ | 7.8″+ |
|---|---|---|---|---|
| <7 mph | 0.58 | 0.19 | 0.05 | -1.25 |
| 7–8.8 mph | -0.86 | -0.82 | -0.46 | -1.81 |
| 8.8–10.8 mph | 0.12 | -0.71 | -0.08 | 0.01 |
| >10.8mph | -0.41 | -0.23 | 1.18 | -0.56 |
Best across the board again. And crossed with vertical movement:
| Velo Diff/VMov | <-1.4″ | -1.4 to 1.5″ | 1.5-4.5″ | 4.5″+ |
|---|---|---|---|---|
| <7 mph | -0.99 | 1.39 | 0.37 | -0.10 |
| 7–8.8 mph | -0.37 | -1.03 | -1.04 | -1.00 |
| 8.8–10.8 mph | 0.42 | -0.99 | 0.13 | -0.19 |
| >10.8mph | -0.10 | 0.08 | 0.05 | -1.39 |
This last one is another interesting finding. That 7–8.8 mph band is still the best, with two exceptions, and those two exceptions are the two rarest buckets in the sample set. The top left corner is fast but hard-dipping; think Garrett Richards’ sharply-dropping laser slider, or Luke Jackson’s hammer slider.
The bottom right corner is even weirder; slow but riding sliders. This category is some assorted great pitches by normal pitchers, plus sidearmers and underhanders. Tyler Rogers and Ryan Thompson alone comprise 20% of that quadrant. Don’t extrapolate too much from it, is my point. The two extremes are, well, extreme. They both work because they’re so far from normal.
I see two obvious avenues for further research after looking through all this data. First, there are the unicorn sliders. If you can throw your slider at a speed that comes near your fastball while generating a ton of movement, you’ll do well. That’s hardly a surprise; did you know that fast pitches with extreme movement tend to do well? But still, who doesn’t like looking at unicorns? I’m sure there are some fun findings there.
Second, I’m interested in the band between -7 and -8.8 mph. It’s an arbitrarily chosen band, one I picked to divide the sample up into fourths, and taking a refined look at that area could yield interesting results. It’s entirely possible that the result is a mere artifact, that there’s something about those particular sliders other than their velocity differential that makes them so effective. There’s only one way to find out, though: More slider research lies ahead.
Ben is a writer at FanGraphs. He can be found on Bluesky @benclemens.
Curious – is there a reason you chose not to include movement from gravity?
Yes, because gravity-induced movement is the same for all thrown balls.
Tyler Rogers warrants his own article based on his savant page, and it definitely lines up with the eye test. Absurdly weak contact is his game, and it’s fun to watch. That rising slider is great.
Also weird that he and his twin probably couldn’t be more opposite in terms of release points. I haven’t figured out which is the evil one yet.
Another great article. My guess about the velocity differential, based upon observation and not analysis, is that the 7-9 mph differential is the best combo of deception – looks more like a fastball and difference – big enough to mess up timing. Closer in speed to fastball means the same swing can catch it. Bigger difference in speed from a fastball, and the batter may recognize it. I believe I’ve seen similar results for change-ups, but I can’t remember when.
Interesting stuff. I believe you raised a fascinating point that was “beyond the scope of this article”. I’m referring to a three dimensional grid, or better, including an addition time dimension. The release speed is easily obtained, but are data on how fast the break takes place available? Example the Wainwright “Charlie” seems to take days to break. Not so with other “tighter” curves. I’m wondering if Statcast can provide the speed of the break. It seems like two sliders that look identical in two dimensions (x and y) (vertical and horizontal) would give different results if one slider broke more quickly than another?
I image it is correlated to the spin rate, but it seems more fundamental.. Why measure the cause (spin rate) vs. the effect (how quickly the ball deviates from straight)? I’m also thinking a three dimension model could provide the same data. The third dimension (longitudinal – the axis from pitcher’s release point to the point of the start of the break) could improve the variability shown on two dimensional track. That is, could measuring the “Z axis” change, provide the same findings? Not sure I’m explaining it well, but, what’s you all think?
So I really want to know….
Should writers pay Fangraphs to be able to think about cool stuff like this or the other way around? It seems a dream occupation…
Baseball stats ROCK THE MULTIVERSE.
Just found out you can’t vote for your own comment. I guess The Donald never got that message😎🤠