
New Wild Cards and the Playoff-Probability Curve
Some say the new wild card is a gimmick to artificially create drama. Some say it rewards teams for wining their divisions. No matter what you think about the new playoff format, it’s here — and the playoff probability curve we’re used to is suddenly out of date.
In March, Major League Baseball announced a major change to the playoffs. Each league would get a second wild card, and the two wild card teams would play a one-game playoff with the winner going to the division series. The change is effective for 2012.
This expansion is the first for baseball since the wild card was instituted in 1995. In the 17 seasons since that change, the probability that a team would make the playoffs — given a number of regular-season wins — is described by the following function:
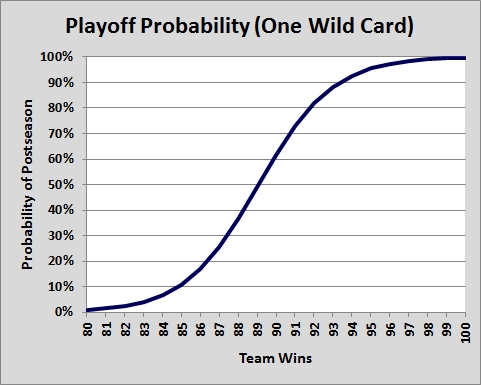
There are two important concepts when analyzing the graphs in this post: inflection point and marginal value of a win. The point of inflection in the above function is between 89 and 90 wins. If a team wins 89 or fewer games, that team has less than a 50% chance to make the playoffs. If a team wins 90 or more, the team has greater than a 50% chance.
The marginal value of a win is the additional probability each win adds. For example, teams winning 96 games have about a 97% chance of making the playoffs. Teams that win 97 games have about a 98% chance. The marginal value of the 97th win is 1%. It should also be noted that, by definition, the marginal value of a win peaks at the point of inflection.
One more housekeeping note: These probabilities are based on averages; they are not specific to a league or to a division. In any given season, 90 wins probably isn’t enough to make the playoffs out of the American League East, but it would probably be enough to make it out of the National League Central.
Going back through the yearly standings and determining the teams that would have won the second wild-card spots — had they existed — allows for the estimation of a new function. An that yields playoff probabilities for the 2012 season:

The new inflection point occurs at about 87 wins. As expected, when you add playoff teams, it becomes easier to make the playoffs. The new wild card also increases the marginal win value around the inflection point. In the old system, the peak marginal win value was about 12.7% for win No. 90. In the new system, the peak marginal win value is 17.4% for win No. 87.
If all you care about is getting out of the regular season, then the story is over right here. Win 87 games and you’ll probably see Game 163. However, I suggest that the real story goes deeper. The new playoff format also created a new wrinkle: all playoff appearances are not created equal. The three division winners in each league basically get a first-round bye. The two wild-card teams have to play-in to the division series. How does this change the playoff probability function?
For all intents, a wild-card spot is now a 50-50 chance to join the division series. Given, the actual odds of the one-game playoff will be skewed toward the home team, but for our purposes we’re not trying to control for home field advantage or team quality. Using this method yields a much more realistic view of playoff probability:

The adjusted function looks similar to the pre-2012 function, but flatter. Technically speaking, they have the same point of inflection — 90 wins — but the marginal value of a win has changed:

Under the old rules, teams needed only to get into the playoffs to make the division round, so getting to the 90-win threshold had a very high marginal value. Under the new rules, teams can get into the postseason at about 87 wins, but they’re not guaranteed a spot in the division series unless they win their division. That takes about 93 wins. Therefore, wins No. 87 through 92 are less important than they used to be — but wins below 87 and above 92 are more important.
To sum up, teams that win 88 or fewer games are better off in 2012 because they have a better chance of making the division series than they used to. Teams that win 89 games or more are worse off because there’s now the possibility they have to play-in to the division series — something they previously might not have had to do. This effect extends all the way into the 100-plus win teams. Remember the 2001 A’s? They won 102 games, but finished second in the American League West, behind the 116-win Mariners. In the new playoff system, Oakland would have had to play 85-win Minnesota in a one-game playoff.
You can argue how that game would have turned out, but there is no question that the A’s would have had one fewer chance making it to the divisional round playing the Twins than they would have by simply hopping on a plane.
Nothing in this analysis attempts to estimate the effect of player fatigue or using an ace to win the one-game playoff. It his highly likely that this analysis underrates the real-world negative effects on the wild card teams. Instead of a wild card being counted as half of a playoff spot, it might be more accurate for it to be 0.4 or even less.
The new wild cards will, without question, keep more teams in the race longer. A team that wins only 84 games now has a 12.6% chance of making the postseason, twice the odds as last year. However, there may be some unintended consequences, with teams in the high 80’s to low 90’s win range having less to gain from a marginal win, and the potential for 100+ win teams to be knocked out by 85-win teams in one game.
For reference, the below graph includes playoff probability curves and marginal win values for both versions of the expanded playoffs –the wild card as a full playoff spot and the wild card as a 50-50 play-in:

Jesse has been writing for FanGraphs since 2010. He is the director of Consumer Insights at GroupM Next, the innovation unit of GroupM, the world’s largest global media investment management operation. Follow him on Twitter @jesseberger.
Great! This is EXACTLY something I’ve wanted to see.
Best Fangraphs post in a while.
Yes, this is very insightful.
To me, it seems intuitive that the fight for WC2 will take more games than for WC1. To win WC2, a club may need to use its ace in Game 162, leaving him unavailable for the Play-In Game, resulting in another incremental gain for WC1.
Indeed, WC2 may need its 3-4-5 starters for the Division Series, where they will play DivWinner1, starting on the road in 2013.
With the trade deadline looming, I’m thinking it may be best to forget about WC2 when considering deals. If it happens, it happens, but the real-world value of WC2 is not so great as to deal away a good prospect.
Comments?
PS: I encourage the use of “play-in game,” because I know the NCAA actively frowns upon that that term, and I can’t imagine MLB as less snobbish that the NCAA!
It’s really going to depend from year-to-year. In some years there will be a close cut between WC2 and going home (probably most years from looking at a quick sample of recent AL standings), but in many years there will be a close cut between WC1 and its respective division winner, in which case the manager might be faced with using his ace on the final day of the season hoping to secure the bye or not using him and saving him for the P-IG, or preferably game 1 of the LDS if the P-IG is avoided.
“With the trade deadline looming, I’m thinking it may be best to forget about WC2 when considering deals. If it happens, it happens, but the real-world value of WC2 is not so great as to deal away a good prospect.”
I agree 100%. But would like to add…doesn’t this also apply to WC1 now? Previously, WC(1) was guaranteed 3 playoff games. Now they are in the same boat as WC2, a virtual coin flip to enter what I will refer to as the ‘actual playoffs’.
I think the only trade that might be questionable through the addition of the wc2 is that a pitchers trade value drops immidiatly. If you have only the play-in game to face first you don’t know if you are be able to use that pitcher. For example the Dodgers now trade for Cole Hamels to give their strong rotation enough bite for a playoff series. But they are going to use Kershaw in a Play-in to ensure that they make it to the NLDS. But now they lose the game and have Cole Hamels not even used in the Playoffs.
But when you sign a position player, for example the Youkilis deal then he is going to help you in that game and every other playoff game. It is basically the old question between the productivity of a 4-man rotation starter and an everyday guy in your line up. And through that WC addition the value of a position player might be higher.
It is amazing taking a look at the American League right now. There are only 3 teams more than a game out of a wild card spot. 11 teams are Eire in the playoffs if it ended today or only a game out….unbelievable.
why is the adjusted probability higher for teams below 84 wins?
i’d also like to see P(divison_winner) P(wild_card) and P(wild_card_2) plotted, out of curiosity moreso than anything else.
That isn’t what an inflection point is. Reaching back a few years, isn’t an inflection point where the slope stops increasing and starts decreasing (or vice versa). Where the differential of the equation equals zero? Did I use those terms right?
no it’s used correctly here. it’s the point where the concavity of the curve changes.
Not quite. It’s where the differential of the slope hits 1 – that is, when when the graph goes from concave upward (a bowl shape) to concave downward (an arch shape). As you can see in the 3rd graph, the line is “accelerating” until about 90 wins, at which point it begins “deccelerating”. That point is the peak of the next graph (where the slope goes from positive to negative).
This is what I took issue with: “The point of inflection in the above function is between 89 and 90 wins. If a team wins 89 or fewer games, that team has less than a 50% chance to make the playoffs. If a team wins 90 or more, the team has greater than a 50% chance.”
That at least heavily implies that an inflection point is when a probability graph passes 50%, which isn’t true.
Yeah, that’s a little confusing. Inflection point does not always mean the 50% point, but it does in this case.
It’s the point at which the second derivative of the function equals zero–in calculus terms. In layman’s terms, you are correct; it’s a point on a graph at which the graph changes concavity.
This is really nerdy, but you can have a function that has no inflection point and many (infinite) second derivatives equal to 0. An example would be f(x)=x. An inflection point is what Matt said above or the point where the second derivative changes signs.
Terrific post. Teams should really be thinking in this way. I’d also be interested in seeing the effect of having to burn your best starter in the playoff game on the subsequent division series, but we will need some years of data to make any analysis on it. Are there enough examples of equivalent scenarios occurring in the past (i.e. 1-game playoffs or must-win game 162’s)?
This is really good. I’m not sure of the implications though. Should some overachieving team like the A’s or Indians trade more, or less, than they would have under the old rules to upgrade? What about an underachieving team like the Red Sox or Tigers? What about a low payroll underachieving team like the Rays? What about a team like the Angels, very likely to get a WC, but with less than 50% shot at the division? It raises a lot of questions.
We’ll just have to wait and see how teams approach it. In my model, there is no incentive to move from WC2 to WC1, but in the real world, there is. Plus, it’s hard to project the final standings from trade deadline, so I would expect most teams that are “in it” to be buyers, even if they are only wild card teams.
I’d agree with that. I think a lot more teams are going to be buyers this year than probably should be, in order to take a shot at that 2nd wild card. Looks at what the Orioles are rumored to be doing. There’s no way they should be buyers but they may be this year because of the 2nd wild card.
As a Red Sox fan, I’ve had a lot of people tell me I must be glad to see a second wild card after what happened last year. This analysis shows why the change (actually a play-in for the wild card) is in fact disadvantageous to the Sox overall – to the extent of seriously compromising their entire approach. The “unintended consequence” here – and I’m not sure how unintended it was – is to undercut the value of the wild card for good teams in strong divisions.
How is a WC2 tiebreaker after 162 games determined?
A game of beer pong between the GM’s and managers of each club.
Awesome. How did you derive the probability curves?
Sweet, a fangraphs post full of graphs!
I think it might be a mistake to extrapolate the second wild card’s wins from past seasons–there might be a lot of teams that are buyers at the trade deadline this year, flattening out the talent a little. This might be a small effect, but I’d predict that the second wild card will tend to have one or two fewer wins, going forward, than the would-be second wild card from past years.
Fair point. Not much we can do about that right now though. We’ll just have wait a few years and run the model with the new data.
This is some beautiful math. Great job.
Outstanding post. I was waiting for something like this to be done.
One other issue…. with just one wildcard, teams “out of it” might not have been playing full out the last few games (calling up prospects, maybe skipping a starter who had a long season); if they were fighting for a 2nd wildcard some of the win totals of these teams could be a bit better.
So the records in years where there is not a wild card race might not be exactly what would have happened….
It’s a good approximation I think but I think the gap is probably less than what you are extrapolating by just looking at past records which likely includes teams that may not have been going full out down the stretch.
If this means a team has to buy fewer wins to get their playoffs lottery ticket it will have a positive effect on baseball. If anything I think it ought to be expanded. Only NCAA Football has a more exclusive post-season Championship format. A 16-team playoff would be wonderful. Don’t care if they all have winning records or not.
So what happens when three or four teams end up tied for a wild card spot?
If WC1 & WC2 are tied, then regular-season performance (as per below) is used. Otherwise (including division winner ties) a game or series of games is played, with teams being seeded as per below.
1. The team with the best record in head to head play.
2. The team with the best overall record ignoring interleague play.
3. The team with the best record in the final 81 games of the season, ignoring interleague play.
4. The team with the best record in the final 82 games of the season, extending backward until the tie is broken.
http://en.wikipedia.org/wiki/Major_League_Baseball_tie-breaking_procedures
Good article, bad rule.