On Miguel Vargas and No-Swing Streaks

Before Miguel Vargas doubled in his first plate appearance of the day last Thursday, he hadn’t lifted the bat off his shoulder his first 12 times up. Nursing a pinky fracture, he was just there to track pitches. Yet initially, this “strategy” paid unanticipated dividends: through seven looks, he walked four times and struck out three times, good for a .571 OBP (albeit with a 42.9% K-rate). However, pitchers ultimately adjusted, sending Vargas back to the dugout the next five times.
Apparently, opposing managers were made privy to his no-swing approach before each game. But even if Dave Roberts didn’t tell them about it, it was in the press as early as the morning of February 27, after which three of Vargas’ walks came. My colleague Davy Andrews, recounting this misadventure, posited that some of the pitchers treated Vargas like any other foe because they were just trying to get into regular-season shape.
But Davy also suggested pitchers may have been a bit incredulous that Vargas wouldn’t swing, up there with his batting gloves on and in his crouch. The incredulity slipped away, though, in those last five looks. Zack Greinke even toyed with Vargas, tossing him a pair of eephuses (eephi?) sandwiched by two full-strength heaters (thanks to Davy for doing the GIF work so I didn’t have to):
All told, while pitch-level data isn’t available for every spring game, Vargas probably saw around 40 pitches during his no-swing streak. That mark easily bested the longest streaks of the 2022 season:
| Player | Streak Length | -Swing% Rank |
|---|---|---|
| Eric Hosmer | 22 | T-76* |
| Jake Cronenworth | 20 | 16 |
| Dalton Guthrie | 20 | T-9* |
| Myles Straw | 19 | 8 |
| Eugenio Suárez | 19 | 17 |
| Ronald Acuña Jr. | 18 | 64 |
| Juan Soto | 18 | 1 |
| Brendan Donovan | 17 | 3* |
| Ben Gamel | 17 | T-26* |
| Trent Grisham | 17 | 3 |
| Daniel Vogelbach | 17 | 1* |
| *Indicates would-be rank, if player had qualified. There were 130 qualifiers. | ||
Unsurprisingly, this list is a who’s who of Swing% laggards, including the likes of Soto and Donovan (though the latter should probably swing more now). Yet, Hosmer and Acuña represented enough of an exception for me to take a deeper look.
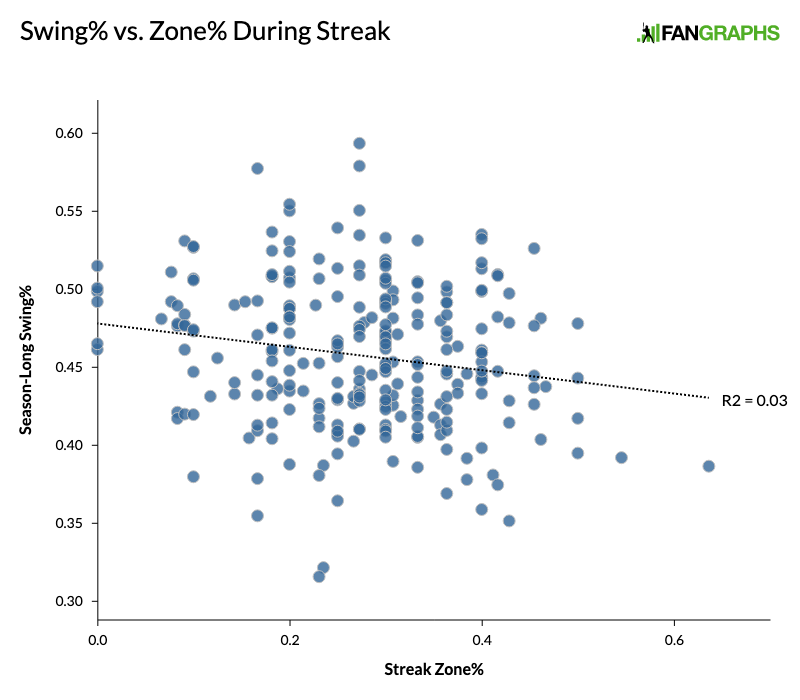
I gathered all 2022 no-swing streaks of at least 10 pitches. After limiting it to one streak per hitter, there were 265. I found that during these streaks, the average Zone% was 27.4%, far lower than the league average of 50.4%. Naturally, hitters who aren’t forced to keep the bat on their shoulder due to injury will only do so for an extended stretch if they aren’t seeing strikes. However, there is somewhat of a relationship between the Swing% of the player in question and the Zone% that they saw during the streak, indicating that the Zone% had to be especially low to prompt a no-swing streak from players like Hosmer:
But the question I was most interested in was if, like with Vargas, pitchers began to adjust to these non-swingers as their streaks continued. So I compared the first five pitches of each streak to the next five:
| Metric | First Five | Next Five |
|---|---|---|
| Zone% | 23.9 | 29.4 |
| Pitcher Zone% | 48.0 | 48.2 |
| Balls | 1.32 | 1.38 |
| Strikes | 0.63 | 0.62 |
The Zone% increased markedly as the streaks wore on. There were slightly more balls for the “next five” pitches, and pitchers do pound the zone more when they’re behind in the count, but this difference wasn’t enough to explain the increase in Zone% on its own. Neither was the negligible difference in the season-long Zone% of opposing pitchers.
Before I could come to a conclusion, however, I needed to control for a few more variables. First, if some change in the opposing team’s attitude towards a non-swinger is what’s causing the higher strike rate, then it makes sense to focus on non-swing streaks that didn’t span multiple games. There were 196 such streaks at least 10 pitches long, again limiting ourselves to one per hitter:
| Metric | First Five | Next Five |
|---|---|---|
| Zone% | 25.8 | 29.5 |
| Pitcher Zone% | 48.6 | 48.1 |
| Balls | 1.34 | 1.39 |
| Strikes | 0.60 | 0.64 |
The change in Zone% was smaller, but still noteworthy. This time, the difference in balls tracked with a similar difference in strikes, which might explain part of the smaller Zone% change. But it’s more likely that this smaller change was due to a larger difference, in the opposite direction, in the season-long Zone% of opposing pitchers.
If we want to be absolutely sure of an attitude change, we can look at streaks that occurred against a single pitcher in a single game. There were 94 that spanned at least 10 pitches:
| Metric | First Five | Next Five |
|---|---|---|
| Zone% | 25.6 | 28.2 |
| Pitcher Zone% | 49.0 | 49.0 |
| Balls | 1.39 | 1.45 |
| Strikes | 0.57 | 0.66 |
Here, the pitcher’s season-long Zone% is controlled for, but the difference in Zone% for the first and second five pitches of the streak narrows even further. The strikes actually increase more than the balls, which might be causing the lower Zone% for the next five pitches. Additionally, though they didn’t typically see lower zone rates throughout the season, those in the single-pitcher streak dataset stood out as the best hitters by walk rate and wOBA:
| Streak Type | Zone% | BB% | wOBA |
|---|---|---|---|
| Single Pitcher | 48.8 | 9.8 | 0.327 |
| Single Game | 49.0 | 9.4 | 0.318 |
| Other | 48.8 | 9.1 | 0.314 |
So maybe pitchers were just more intimidated, and continued to be intimidated, by these hitters despite their ongoing refusal to swing; that could be driving the smaller gap here.
Overall, there is some decent evidence suggesting that the longer a hitter keeps the bat on their shoulder, the more strikes they’ll see, independent of count and individual tendencies. If we take this result at face value, there are a couple of possible explanations for it. To begin with, à la Vargas, the longer a no-swing streak stretches on, the more likely a pitcher is to catch on and start throwing in the zone more. On the hitter’s side, perhaps after sitting on several pitches, they grow accustomed to taking and continue to do so even as the low Zone% they had previously seen begins to regress back towards the mean.
While we shouldn’t expect to see hitters in the box just to track pitches during the regular season, there are games where they might as well be. And Vargas’ strange spring has provided us insight into how those hitters might fare.
Alex is a FanGraphs contributor. His work has also appeared at Pinstripe Alley, Pitcher List, and Sports Info Solutions. He is especially interested in how and why players make decisions, something he struggles with in daily life. You can find him on Twitter @Mind_OverBatter.
This was fun. Can you do one for swing streaks too? I’m guessing the swing streak record is lower that the no-swing streak record.
You read my mind! I’ll include info on swing streaks in my next piece.