
Parsing a Pile of Confusing Data About Sliders
What’s the most important characteristic of a slider? Let me show you a table:
| Attack Zone | Run Value | RV/100 Pitches |
|---|---|---|
| Heart | -138.9 | -0.7 |
| Shadow | -785.0 | -2.5 |
| Chase | 163.8 | 0.8 |
| Waste | 465.2 | 4.5 |
There are two things that might need explaining in here. The attack zones are Baseball Savant’s way of cutting the strike zone up into granular pieces, and I think they’re neat. They look like so:
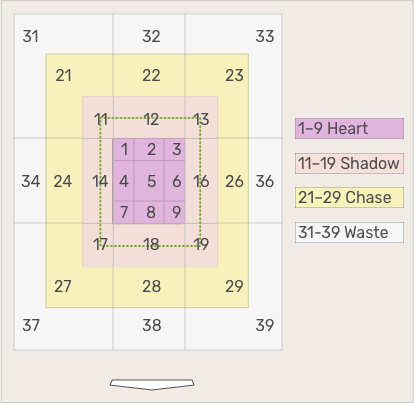
Run values are from the batter’s perspective, so that -785 runs in the shadow zone means that batters have been 785 runs below average — what they’ve done on all pitches across the whole year — when they faced sliders in the shadow zone. In other words, sliders on the corners of the plate have been excellent — not really a shock.
What’s the most important characteristic of a slider, then? Well, allow me to show you a different table:
| Velocity (mph) | Run Value | RV/100 |
|---|---|---|
| 87+ | -149.3 | -0.8 |
| 85-87 | -80.6 | -0.4 |
| 82-85 | -43.8 | -0.2 |
| <82 | 37.2 | 0.2 |
This is hardly surprising; you don’t need me to tell you that it’s harder to hit faster sliders. The surprise was the magnitude, but maybe it shouldn’t be. Jacob deGrom’s hard slider is obviously excellent, but so is Joe Musgrove’s mid-speed offering. Steven Matz throws one of the hardest sliders in the game, particularly for a starter, and it’s always been a middling pitch. Velo matters, but not as much as you’d expect.
Let’s continue the gimmick: what’s the most important characteristic of a slider? Here, take a look at this table:
| Horiz. Break | Run Value | RV/100 |
|---|---|---|
| 7.8″+ | -107.8 | -0.6 |
| 4.9-7.7″ | -30.4 | -0.2 |
| 2.5-4.8″ | -67.9 | -0.4 |
| <2.5″ | -30.4 | -0.2 |
Finally, we seem to have found something that matters less. Just one problem: it seems like it should be the thing that matters most. Big-bending sliders look so cool on TV, and batters look foolish against them. The group with the least break are mostly backup sliders — with minimal glove-side movement or even arm-side movement. These are the sliders that hang up and make announcers gasp with disappointment. Those mistakes perform just fine!
Clearly, my lazy one-factor description of sliders isn’t going to work. Let’s go to the next level down and combine two of these indicators to see if we can learn anything more. Here’s a grid of velocity crossed with location:
| Velo/Location | Heart | Shadow | Chase | Waste |
|---|---|---|---|---|
| 87+ | -0.94 | -3.41 | 0.19 | 4.24 |
| 85-86 | -0.90 | -2.76 | 0.86 | 4.65 |
| 82-84 | -0.49 | -2.24 | 0.91 | 4.22 |
| <82 | -0.54 | -1.85 | 1.55 | 5.18 |
Throwing hard is obviously great, but it’s not a miracle cure. The shape of each velocity bucket is the same: over the heart is okay on average, the edges of the plate are wonderful, and nothing else is particularly good. Faster is better more or less across the board, but variation by speed is much smaller than variation by zone. Hit the shadow zone and win a prize, regardless of your slider’s zip.
What about horizontal movement crossed with location? This one is quite weird, but it’s telling:
| HMov/Location | Heart | Shadow | Chase | Waste |
|---|---|---|---|---|
| 7.8″+ | -2.51 | -2.53 | 1.08 | 4.63 |
| 4.9-7.7″ | 0.21 | -2.32 | 0.62 | 4.43 |
| 2.5-4.8″ | -0.63 | -2.60 | 0.58 | 4.37 |
| <2.5″ | -0.01 | -2.65 | 1.04 | 4.56 |
If you’re throwing over the middle of the plate, it pays to have movement. To some extent, that’s obvious — batters swing when you attack the middle of the strike zone, and it’s harder to hit pitches with big break. I’m less sure about the second group of pitches — with above-average but not extreme horizontal movement. In a statistical sense, that poor result is significant; there are more than 4,000 pitches in each bucket, so a difference of 0.84 runs per 100 pitches (relative to the third bucket) is large enough that it’s extremely unlikely to occur due to chance. But I wonder about other factors involved in both, enough to say that the only clear takeaway is that huge movement is great in-zone.
Leave the zone, and the opposite appears to be true. Big-breaking sliders have the worst results in the chase and waste zones, and they’re roughly average in the shadow zone. That agrees with a recent finding by Tom Tango that pitches with lots of break perform better in the zone. His finding was different — he was looking for pitches that had a lot of break for that particular pitcher rather than overall — but the general findings point in the same direction.
Lastly, here’s one more combination, velocity crossed with movement:
| Velo/HMov | <2.5″ | 2.5-4.8″ | 4.9-7.7″ | 7.8″+ |
|---|---|---|---|---|
| 87+ | -0.16 | -1.07 | -1.03 | -2.50 |
| 85-86 | -0.40 | -0.36 | -0.10 | -1.45 |
| 82-84 | -0.05 | -0.24 | 0.01 | -0.35 |
| <82 | 0.29 | 0.71 | 0.99 | -0.30 |
I don’t know, this one doesn’t speak to me. Slow sliders are not good at all unless they break a ton; that checks out. Fast sliders are better if they break a ton; yep, I buy it. Mid-velocity sliders are… Basically, they’re a whole mess. Again, sure, I buy it, but this finding is less interesting to me than the zone-based ones. There’s even an increased complexity in the fact that some of the outlier observations are subject to severe survivorship bias. If you throw a 75 mph slider that doesn’t break, you’re either doing something else great or you aren’t a major leaguer. It’s a complex problem to analyze, is my point.
What do all these grids mean? Partially, they mean I love to make grids. It’s a very satisfying way to present a big pile of information all at once, and boy is there a lot of data to consider in this particular instance.
That aside, I think there are several major takeaways from all of this. First, it’s clear from every slice that getting your breaking pitches near the strike zone pays off. Some of this is obvious — the edges of the plate are always a great place to live as a pitcher — but I was surprised by just how true that was, even for sliders.
There’s a sharp count effect here, though, one that isn’t immediately evident in the data. With two strikes, the pattern looks completely different:
| Attack Zone | RV/100 |
|---|---|
| Heart | 0.94 |
| Shadow | -3.62 |
| Chase | -1.54 |
| Waste | 4.36 |
That’s not a surprising finding. It’s something baseball players and analysts have known implicitly for decades. Batters defend the plate more with two strikes, so swing rates go up. Given that plenty of the value in throwing over the heart of the plate lies in called strikes, it becomes relatively less attractive; in fact, leaving one over the heart as compared to throwing it in the “chase” zone goes from 1.5 runs better per 100 pitches to 2.5 runs worse, a huge swing.
So, heart early in counts and chase late — shadow all the time, of course, but everyone was already trying to do that. That’s obvious, but my favorite takeaway has to do with the intersection of movement and location. Big, sweeping sliders excel over the heart of the plate. Garden-variety sliders aren’t so good there; leave it over the heart of the plate, and you might get tattooed, whereas it’s hard to hit a pitch that’s breaking eight or nine inches sideways on its path home.
Which pitchers are accounting for this by throwing pitches with more movement in the strike zone? There are no pitchers in the game who have thrown at least 10 sliders in both the heart/shadow and chase/waste buckets, get 7.8 inches or more of horizontal break over the plate, and get less than 7.8 inches of break when they’re off the plate. Dallas Keuchel, however, comes close; his sliders that are around the strike zone have a horizontal break of 10.3 inches on average, while his pitches in the chase and waste zones break only 8.5 inches.
Perhaps more importantly, pitchers with big sliders should flood the zone when they can. Forget modulating your slider based on location — if you have the ability to throw a big slider, focusing on the zone should be priority number one. Collin McHugh, Yu Darvish, Shohei Ohtani, and Caleb Thielbar all excel at getting their big-movement sliders into and around the strike zone. They’ve all had success with the pitch this year. I’m certainly cherry-picking results, but the theory makes a lot of sense to me.
There’s plenty more to unpack here. The data suggests that pitchers with middling sliders might want to attack the strike zone with it but only early in counts, relying on something else for a putaway pitch. On the other hand, nothing appears more important than hitting the corners of the plate. Perhaps pitchers with middling-movement sliders should focus less on changing the shape of the pitch and more on repeating their delivery to hit the corners.
John Means doesn’t have a fearsome slider; with an average horizontal break of 3.5 inches, it’s in the bottom third of all sliders. It’s also been a tremendously valuable pitch this year after being so-so before. Why? Well, he’s hitting the shadow zone with 55.4% of his sliders so far this year, and that’s the best thing you can do to add value. Before this year, he’d only located 39.6% of his sliders at the periphery of the zone, and the pitch was worse. More corners, better results: it’s easy math.
I’m sure I’ll come up with more takeaways from this mountain of data, but I’d love to hear what you have to say, too. Are pitchers unconsciously taking advantage of this already? Are teams teaching it? I have no idea! But it’s a strong effect, and I’m anxious to hear more theories about why it exists and what pitchers (and hitters!) can do about it.
Ben is a writer at FanGraphs. He can be found on Bluesky @benclemens.
Hot take: sliders are difficult to hit.
So this is super fun and data-rific. It is!
It also suffers from the same problem as every other “what makes a good pitch” article. Namely that it doesn’t take into account how the pitch plays with the other things in a guy’s arsenal. Two pitchers may throw nearly identical sliders and have very different results because Pitcher A’s slider looks like his change until it breaks late, but Pitcher B’s slider is identifiable the moment it leaves his hand.
Yeah, totally agree, and totally beyond me how to fit that in here on a systematic basis instead of case-by-case sadly.
I have seen the gifs showing the difference in trajectory between a pitcher’s various pitches. It seems a pitcher’s effectiveness might be quantified by looking at: 1) some quantification in the distance between those pitches and where they cross the plate; 2) difference in their velocities. Adding to the complexity is the number of different pitches, and how do you take into consideration an additional pitch and the additional spread that pitch provides to the arsenal. With differential math, perhaps you could calculate the volume between the various points of the different pitches using the fastest pitch and when it crosses the plate as a reference, to correlate with effectiveness of each individual pitch.
Having seen those gifs, I can imagine this is what a batter deals with at the plate. The bigger the “volume” between the various pitches, the more the unpredictability. A batter could also probably get used to a pitcher by learning that volume.
This is cool, and fun to think about – thanks. Am I correct that the pitch locations are based on an estimate of where the pitch crosses the plate, and not where it starts off heading? It seems to me like there might well be some interaction with swing rate in the values you’re seeing – a “big” slider is probably more likely to be a called strike in the heart of the zone than a little one. How did you come up with the movement bins. I wonder if sliders that greatly deviate from a pitcher’s norm (back up sliders) have better than expected results when compared to sliders with similar horizontal movement when that amount of movement is typical for the pitcher.
Yeah, all the locations are based on where the ball crossed the plate, measured by Hawkeye. I just binned them out into quarters across all sliders (for both velo and movement), and didn’t control for a pitcher’s normal movement — the linked Tango article did the bucketing as compared to a pitcher’s norm and found that backup sliders were really dangerous over the plate, less bad on the fringes.
Great article. One dimension that might be readily quantifiable is fastball-slider differential. Just as with buckets for location and break, you could have buckets for this differential. Sequencing would be fascinating too but might be more difficult to compute, especially in combination with other dimensions.
Ahha, thanks for the answers. Really fun article.
Some credit Chief Bender as the first pitcher to use a slider. He also radiated the most big dick energy of anyone in baseball. Because he was Native American he faced discrimination on the field. Quoting from his Wikipedia article: “taunting from the bench was common in Bender’s era and the opposition or the fans often made war whoops or yelled taunts such as ‘Nig!’ or ‘Back to the reservation!’ Bender usually remained calm, sometimes smiling at the insults. After an inning in which he had pitched particularly well, he might yell back, ‘Foreigners! Foreigners!'”
Okay this is epic.
I’m thinking about Kevin Goldstein’s piece on fastball shape here. Middling movement would put a pitch right on that diagonal line, wouldn’t it? Whereas John Means’ slider being in the bottom third in movement would mean it doesn’t move the way batters expect sliders to move, so that might actually be a good thing.
Missing are late break and vertical break consideration. Slurvey, down-breaking sliders are often very effective, Scherzer’s being a prime example, he gets a lot more vertical than horizontal break most of the time, and it’s one of the better pitches in the game.
Would make sense that the big bendy pitches are effective in the zone, because often people see those and think they are going to veer out of the zone and don’t swing (my mind drifts back to watching Beltran let that Waino pitch go by in the NLCS- we know anecdotally that such pitches can ‘freeze’ a batter) Would be interesting to see the rate of called strikes of pitches with great movement vs others.
In general, I am skeptical that you can encapsulate slider value by just looking at the slider. There has to be some sort of dependency on the other pitches, particularly the fastball. This would explain why some pitchers have great success with sliders that aren’t visually or numerically standouts.
First off, I love these articles of “I’ve got some data. Can I take anything away from it?” Please continue these!
Broadcasters always talk about the velocity difference a pitcher’s fastball and breaking ball. Would it be possible to see how much that actually matters? Depending on how you got your slider data, you could do pitcher’s average fastball velocity minus slider velocity.
I’d conclude from this that the simplest solution is Sergio Romo’s, the no dot slider.
BTW, this would be great to see on the Cutter as well.
I think it’s great to use data to verify that commonly held baseball assumptions are actually valid and it seems to me like this is exactly what this article has done.
1. We now have actual evidence that there is such a thing as a get-me-over slider early in counts and that it’s an effective pitch so long as it actually breaks a lot.
2. When you’re up in the count you shouldn’t be throwing over the middle.
3. Sliders that are fast and break are hit less than ones that aren’t.
Maybe this also gives credence to the idea of a hanging breaking pitch, i.e., if you are in a 2-strike count, and throw a slower slider that doesn’t break, you are going to get hit more than if you stay off the heart of the zone with something faster that breaks more.
Great work!
The sliders with above average but not extreme horizontal movement over the heart of the plate may do worse than sliders with below average movement because they line up better with the swing path. It may help to look at platoon effects
MLB2018-2020 Various Stats for Slider in Heart Zone by Horizontal Movement
pfx_x (-0.25/0.0/2.5/5.0/7.5/1.00)
Swing% (75.2/74.5/72.6/70.6/66.0/62.6)
If the horizontal movement is greater, the batter will not swing even with Heart, which is a big advantage because Heart can earn strikes.
Contact%(82.8/83.8/84.7/84.3/82.4/83.8)
Contact% has leveled off.
xwOBAcon(0.413/0.410/0.408/0.398/0.382/0.349)
xwOBAcon drops significantly when it exceeds 1 foot.
From the above, it seems that the main reason why Heart’s slider with large horizontal movement has better stats is that it doesn’t let the ball swing and only weakly hits the ball when it makes contact.