
Pick-offs and Stolen Base Attempts
Last week, I looked at which teams were most likely to have players thrown out while running the bases (e.g caught stealing, picked-off, throw out while trying to take extra base, etc). In the comments of the article, it was discussed that the more aggressive base running teams are more likely to be thrown out on the bases. I am working toward a better solution for those base running numbers, but in the meantime I found some nice information on players getting picked-off.
The more aggressive a team is at attempting a stolen base, the more likely they are of getting picked-off. It seems like common sense to me, but I have had too many incorrect ideas to leave it only to instinct. The following graph looks at the attempted steals versus pick-offs for all teams from 2005 to 2009:
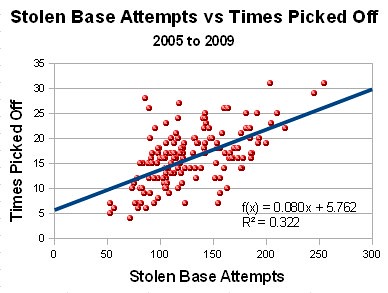
As it can be seen, the more aggressive a team is attempting to steal, the more likely they are of getting picked-off. Using the equation of the best fit line, it can be determined that for every 12.5 stolen base a team attempts, one player is likely to get picked off (12.5 attempts * 0.080 = 1).
Note: The relationship between the two values, doesn’t mean that one directly caused the other. There could be other factors at work on the two values.
I took this examination one step further and compared the times caught stealing versus time picked-off. I was looking to see if teams that were bad at stealing bases were also bad at getting picked-off:

My hunch was correct in that the r-squared (how closed one set of values correlates to another sets of values) is a bit higher (0.37 vs 0.32) for the caught stealing data. Using the values from the equation, it can be shown that for every 3 times a player is caught stealing, they are likely to be picked-off once (0.32 * 3 = ~1).
So far this season the numbers are similar to the previous 5 seasons as seen in the following two graphs:
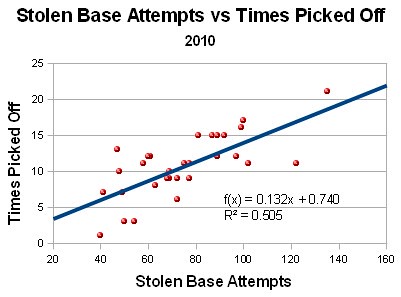
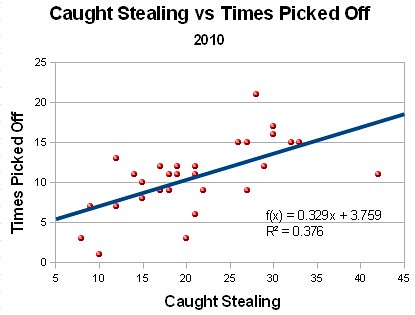
Aggressive base stealing teams are more likely to be picked-off thereby removing a base runner. Rich Lederer proposed back in 2006 that the caught stealing value should include both caught stealing and picked-off numbers. I am not sure how the baseball community would accept that change, but if someone does include picked-off outs into caught stealing values, I could understand the reason why. For now it seems that teams looking to get an extra jump for a stolen base seem get thrown before they have the chance than those that are less likely to attempt the steal in the first place.
Jeff, one of the authors of the fantasy baseball guide,The Process, writes for RotoGraphs, The Hardball Times, Rotowire, Baseball America, and BaseballHQ. He has been nominated for two SABR Analytics Research Award for Contemporary Analysis and won it in 2013 in tandem with Bill Petti. He has won four FSWA Awards including on for his Mining the News series. He's won Tout Wars three times, LABR twice, and got his first NFBC Main Event win in 2021. Follow him on Twitter @jeffwzimmerman.
Whats the slope and correlation between SB successes and times picked off. If it’s lower than the caught stealings, it could be that good basestealing teams avoid pickoffs in addition to stealing more bases, or the other way around.
The equation for successful stolen base vs picked off is:
f(x) = 0.086x+8.129
r-squared = 0.244
Graph:
http://farm5.static.flickr.com/4116/4786612470_489724940e.jpg
It is pretty close to the attempt line.
Does the relationship hold true to individual players as well, or are pickoffs of individual players too rare to really get meaningful numbers out?
I don’t have the data available right, I was just working with team data. Let me see what I can find.
There is a clear relationship here – but it is quite weak – .374 r square etc. So, let’s not over exaggerate the conclusion. There is a lot of variance here – the more interesting question now becomes why are some teams quite good at attempting steals without getting picked off while others are not. One of the teams attempted about 150 steals with only 6 or 7 pick offs in the first graph while another was picked off 27 times – why is that it.
I am hoping to find other possible causes. The rest of the baseball running data is a little harder to piece together and evaluate, but I am getting there. Stay tuned.
Hit and runs should be factored some how especially deciding a single players stats. He has been picked off because the coach called a sign expecting contact when batter fails then probably a guy who should not be stealing just got caught stealing.
excellent article, thanks for including the graphs!
I love graphs – I will probably put in too many than not enough.
Clear correlation, but I wouldn’t exactly go into a meeting w/ those r-squared values.
Doesn’t the team that has Scott Podsednik sort of ruin this (or at least become the outliar)? Not only does he steal a lot of bases, but he’s also very very very good at getting picked off?
He is also 2nd in MLB in CS.
Way to rub salt into my wounds that are my Royal’s loyalty.
I haven’t really studied statistics in a while, is an r^2 valued of .374 high enough to even say there’s really a correlation. That value seems pretty weak, almost to the point of being statistically insignificant.
Also, just out of curiosity, if you still have the statistics at hand, who are the two teams that had less than 100 SB attempts and more than 25 times picked off. Those seem like extremely awful outliers, to the point where it might be making the relationship look worse than it really should be.
I probably missed something but why are runners who W or are HBP or get on because of CI not included? Aren’t they just as likely to attempt a steal as any other runner? And do you think there is any correlation to base running philosophy (Managers who like play station-to-station, 3-Run HR, etc., verses a more aggressive style) and the percentage you are projecting? Thanks for the article.