Pitcher zStats at the Quarter-Mark
Not everyone is interested in projecting the future, but one common thread in much of modern analytics in this regard is the attempt to describe a volatile thing, such as a play in baseball, using something less volatile, such as an underlying ability. This era arguably began with Voros McCracken’s DIPS research that he released 20 years ago to a wider audience than just us usenet dorks. Voros’ thesis has been modified with new information, and people tend to say (mistakenly) that he was arguing that pitchers had no control over balls in play, but DIPS and BABIP changed how we looked at pitcher/defense interaction more than any peripheral-type of number preceding it.
One of the things I want to try to project is what types of performance lead to the so-called Three True Outcomes (home run, walk, strikeout) rather than just tallying those outcomes. For example, what type of performances lead to strikeouts? I’m not just talking about velocity and stuff, but the batter-pitcher interactions at the plate — things like a pitcher’s contact percentage, which for pitchers with 100 batters faced in consecutive years from 2002 has a similar or greater r^2 to itself (0.53) than either walk rate (0.26) or strikeout rate (0.51) does. Contact rate alone has an r^2 of 0.37 when comparing it to the future strikeout rate.
As it turns out, you can explain actual strikeout rate from this synthetic estimate quite accurately, with an r^2 in the low 0.8 range.
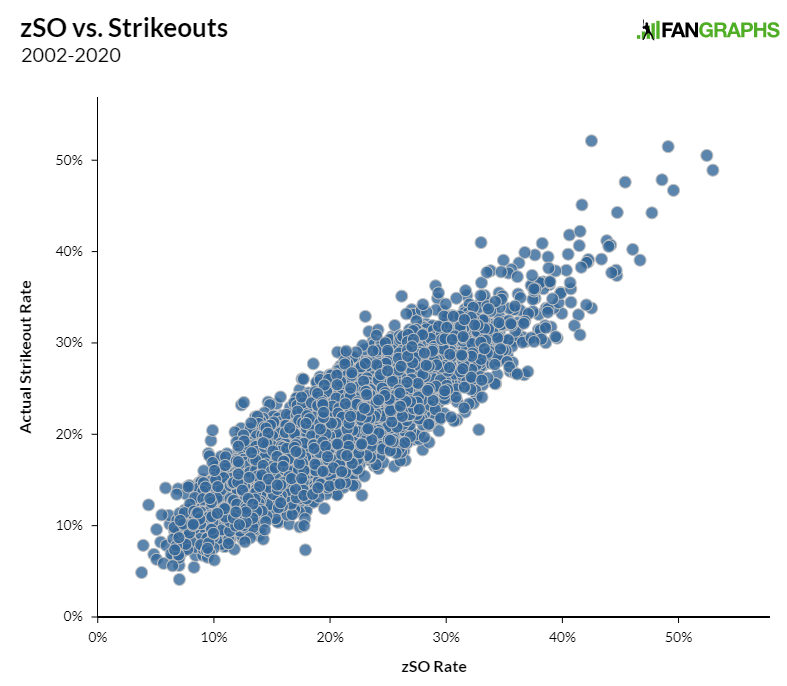
Statcast era data works slightly better; the version of zSO which has that data is at 0.84, and the one that predates Statcast data is at 0.80. Cross-validating using repeated random subsampling (our data is limited, as there’s no “other” MLB to compare it to) yields the same results.
Like the various x measures in Statcast, these numbers shouldn’t be taken as projections in themselves. While zSO projects future strikeout rate slightly more accurately than the actual rate itself does, a mixture of both gets a better r^2 (0.59 for the sample outlined above) than either does on its own. Looking at zSO alone as a useful leading indicator, however, gives us an idea of which players may be outperforming or underperforming their strikeout rates so far this season. All numbers are through Wednesday night.
| Name | SO | zSO | Diff |
|---|---|---|---|
| Matthew Boyd | 37 | 48.9 | 11.9 |
| Zach Plesac | 37 | 48.1 | 11.1 |
| John Means | 59 | 69.4 | 10.4 |
| Matt Shoemaker | 25 | 34.2 | 9.2 |
| Julio Urías | 60 | 69.2 | 9.2 |
| Joe Ross | 33 | 41.7 | 8.7 |
| Josh Tomlin | 14 | 22.5 | 8.5 |
| Michael Fulmer | 29 | 37.5 | 8.5 |
| Kyle Gibson | 44 | 52.1 | 8.1 |
| Joel Payamps | 10 | 18.0 | 8.0 |
| Chase Anderson | 26 | 33.9 | 7.9 |
| Sandy Alcantara | 51 | 58.6 | 7.6 |
| Wandy Peralta | 15 | 22.6 | 7.6 |
| Bryse Wilson | 11 | 18.6 | 7.6 |
| J.P. Feyereisen | 20 | 27.3 | 7.3 |
| Name | SO | zSO | Diff |
|---|---|---|---|
| Trevor Bauer | 77 | 62.4 | -14.6 |
| Cristian Javier | 53 | 38.5 | -14.5 |
| Blake Snell | 60 | 49.8 | -10.2 |
| Zach Eflin | 57 | 46.8 | -10.2 |
| Steven Matz | 46 | 36.4 | -9.6 |
| Gerrit Cole | 85 | 75.7 | -9.3 |
| Nick Pivetta | 42 | 33.1 | -8.9 |
| Tyler Matzek | 27 | 18.3 | -8.7 |
| Adrian Houser | 34 | 25.5 | -8.5 |
| Drew Steckenrider | 21 | 12.7 | -8.3 |
| David Peterson | 46 | 37.7 | -8.3 |
| Caleb Thielbar | 28 | 19.8 | -8.2 |
| Jake McGee | 26 | 17.8 | -8.2 |
| Lance Lynn | 46 | 37.8 | -8.2 |
| Eduardo Rodriguez | 48 | 40.0 | -8.0 |
For me, John Means is the most interesting name on this list, in that while he seems to be performing over his head on an overall basis (1.70 ERA versus a FIP just over 3.24), there may be strikeouts left to gain. He’s not a particularly hard thrower in terms of overall velocity — though he can hit the mid-90s far more than he did in his rookie season — but his swinging-strike and overall contact rates are right at the back of the top 10 in baseball among qualifying pitchers. You can also see why the Yankees were interesting in acquiring Wandy Peralta a few weeks ago.
On the flip side, zSO sees Steven Matz’s strikeout rate coming back to earth. Matz throws harder than many appreciate, but he’s also not a particularly good swing-and-miss guy. Gerrit Cole’s strikeout rate also comes down in this measure, though in his case, “merely” to 12 strikeouts a game.
| Name | BB | zBB | Diff |
|---|---|---|---|
| Justin Dunn | 22 | 13.0 | -9.0 |
| Lucas Giolito | 21 | 12.7 | -8.3 |
| Nick Pivetta | 22 | 13.9 | -8.1 |
| Triston McKenzie | 25 | 17.0 | -8.0 |
| Trevor Williams | 18 | 10.5 | -7.5 |
| John Gant | 28 | 20.9 | -7.1 |
| Jose Quintana | 19 | 11.9 | -7.1 |
| Corey Kluber | 20 | 13.2 | -6.8 |
| Joe Jiménez | 9 | 2.3 | -6.7 |
| Kenley Jansen | 15 | 8.3 | -6.7 |
| Mitch Keller | 20 | 14.1 | -5.9 |
| Nick Neidert | 11 | 5.2 | -5.8 |
| Austin Gomber | 22 | 16.4 | -5.6 |
| Erick Fedde | 18 | 12.4 | -5.6 |
| Tyler Webb | 14 | 8.6 | -5.4 |
| Name | BB | zBB | Diff |
|---|---|---|---|
| Gerrit Cole | 5 | 14.7 | 9.7 |
| Zach Eflin | 5 | 12.6 | 7.6 |
| Max Scherzer | 12 | 18.7 | 6.7 |
| Corbin Burnes | 2 | 8.7 | 6.7 |
| Cristian Javier | 15 | 21.6 | 6.6 |
| Matt Peacock | 3 | 8.8 | 5.8 |
| Clay Holmes | 6 | 11.8 | 5.8 |
| Chad Green | 3 | 8.6 | 5.6 |
| Aaron Nola | 9 | 14.5 | 5.5 |
| Jack Flaherty | 17 | 22.5 | 5.5 |
| Yu Darvish | 13 | 18.5 | 5.5 |
| Johnny Cueto | 5 | 10.4 | 5.4 |
| Craig Stammen | 4 | 9.2 | 5.2 |
| Walker Buehler | 7 | 12.2 | 5.2 |
| Antonio Senzatela | 12 | 17.2 | 5.2 |
As simplistic as it sounds, a lot of avoiding walks is simply getting off to 0–1 counts instead of 1–0. The percentage of times a pitcher gets off a first strike has a significantly stronger relationship to walk rate (r^2 of 0.32) than something more traditionally associated with walks, zone rate (0.05). I suspect this is one of those instances, such as clutch performance, in which people too liberally apply the lesson of lower levels of baseball to the majors. To a 12-year-old, avoiding walks is basically just being good at throwing in the strike zone. At the major league level, every pitcher can hit the strike zone (except maybe Brad Pennington), and it becomes more a battle for initiative and timing.
Lucas Giolito isn’t having anywhere near as strong a season as he had the last two years, but zBB doesn’t think it has much to do with his walks continuing to drift in a negative direction. ZiPS is more negative than its very optimistic projection at the start of the season, but that’s more due to strikeout rate decline where ZiPS saw the potential for improvement. I’m a little perturbed that zBB dares to give Corbin Burnes a whopping eight walks, but that’s still the best walk rate in baseball.
Of note, just missing the list of overperformers is poor Sam Selman, who walked nearly 20% of the batters he faced over five appearances. zBB thinks he should actually have done worse, with eight walks. This is a small sample, but zBB was quite cruel in this instance.
| Name | HR | zHR | Diff |
|---|---|---|---|
| Cristian Javier | 7 | 0.9 | -6.1 |
| Robbie Ray | 11 | 5.3 | -5.7 |
| Kyle Hendricks | 11 | 5.9 | -5.1 |
| Jorge López | 8 | 3.4 | -4.6 |
| Adbert Alzolay | 8 | 3.7 | -4.3 |
| Patrick Corbin | 10 | 5.9 | -4.1 |
| Tarik Skubal | 12 | 8.1 | -3.9 |
| Yusei Kikuchi | 9 | 5.2 | -3.8 |
| Logan Allen | 7 | 3.2 | -3.8 |
| Buck Farmer | 6 | 2.3 | -3.7 |
| Griffin Canning | 7 | 3.4 | -3.6 |
| Adam Wainwright | 9 | 5.4 | -3.6 |
| Matt Shoemaker | 10 | 6.5 | -3.5 |
| Dean Kremer | 8 | 4.5 | -3.5 |
| Jameson Taillon | 9 | 5.6 | -3.4 |
| Name | HR | zHR | Diff |
|---|---|---|---|
| José Ureña | 2 | 6.2 | 4.2 |
| Trevor Rogers | 3 | 6.8 | 3.8 |
| Carlos Martinez | 2 | 5.7 | 3.7 |
| Zac Gallen | 1 | 4.6 | 3.6 |
| Madison Bumgarner | 6 | 9.2 | 3.2 |
| Corey Kluber | 4 | 7.1 | 3.1 |
| Matthew Boyd | 2 | 5.1 | 3.1 |
| Nathan Eovaldi | 0 | 3.1 | 3.1 |
| Nick Pivetta | 3 | 6.1 | 3.1 |
| Martín Pérez | 2 | 5.0 | 3.0 |
| Taijuan Walker | 1 | 4.0 | 3.0 |
| César Valdez | 0 | 2.9 | 2.9 |
| Scott Barlow | 0 | 2.8 | 2.8 |
| Dane Dunning | 2 | 4.7 | 2.7 |
| Will Vest | 1 | 3.7 | 2.7 |
Projecting home runs for pitchers is notoriously difficult and will remain so. Without knowing each individual hit — I’m not trying to outStatcast Statcast — I can only get a pitcher’s zHR rate’s r^2 to around the 0.4 range. The usual stuff correlates here: hitting the ball hard and hitting the ball in the air, with more minor roles for things like velocity and pull tendency. The percentage of non–four-seam fastballs going up also tends to suppress home run rates. But these will always be hard to predict.
| Name | ERA | zFIP | ER | zER | Diff |
|---|---|---|---|---|---|
| Luis Castillo | 7.44 | 3.07 | 35 | 14.4 | -20.6 |
| Dylan Bundy | 6.02 | 3.21 | 29 | 15.5 | -13.5 |
| José Quintana | 8.53 | 3.96 | 24 | 11.1 | -12.9 |
| Jorge López | 6.35 | 3.11 | 24 | 11.8 | -12.2 |
| Nathan Eovaldi | 4.50 | 2.53 | 25 | 14.1 | -10.9 |
| Germán Márquez | 5.56 | 3.49 | 28 | 17.6 | -10.4 |
| Yency Almonte | 11.77 | 4.58 | 17 | 6.6 | -10.4 |
| Daniel Lynch | 15.75 | 4.68 | 14 | 4.2 | -9.8 |
| Trevor Cahill | 6.81 | 4.40 | 27 | 17.4 | -9.6 |
| Mitch Keller | 7.16 | 4.57 | 26 | 16.6 | -9.4 |
| Patrick Corbin | 6.10 | 4.08 | 28 | 18.7 | -9.3 |
| Jose De Leon | 8.35 | 3.92 | 17 | 8.0 | -9.0 |
| Trevor Williams | 6.27 | 3.84 | 23 | 14.1 | -8.9 |
| Joey Lucchesi | 9.19 | 4.14 | 16 | 7.2 | -8.8 |
| Andrew Heaney | 5.31 | 3.31 | 23 | 14.3 | -8.7 |
| Name | ERA | zFIP | ER | zER | Diff |
|---|---|---|---|---|---|
| Yu Darvish | 1.81 | 3.57 | 11 | 21.7 | 10.7 |
| Lance Lynn | 1.55 | 3.89 | 7 | 17.6 | 10.6 |
| Anthony DeSclafani | 2.03 | 3.75 | 12 | 22.2 | 10.2 |
| Trevor Rogers | 1.74 | 3.49 | 10 | 20.0 | 10.0 |
| Ryan Weathers | 1.37 | 4.73 | 4 | 13.8 | 9.8 |
| Trevor Bauer | 2.20 | 3.72 | 14 | 23.7 | 9.7 |
| Sam Selman | 7.36 | 29.95 | 3 | 12.2 | 9.2 |
| John Gant | 2.04 | 4.10 | 9 | 18.1 | 9.1 |
| Aaron Civale | 3.30 | 4.61 | 22 | 30.8 | 8.8 |
| John Means | 1.70 | 3.03 | 11 | 19.7 | 8.7 |
| Kevin Gausman | 1.66 | 2.90 | 11 | 19.3 | 8.3 |
| Jack Flaherty | 2.53 | 3.90 | 15 | 23.1 | 8.1 |
| Alex Reyes | 0.39 | 3.56 | 1 | 9.1 | 8.1 |
| Tyler Rogers | 0.70 | 3.46 | 2 | 9.9 | 7.9 |
| Kyle Gibson | 2.32 | 3.55 | 14 | 21.5 | 7.5 |
(Poor Sam Selman.)
Combine it all together and you get zFIP, which is more stable long-term and projects itself better than either ERA or FIP do. zFIP shouldn’t be used alone to make projections, but by itself, it projects the future as well as SIERA does, with year-to-year r^2 in the 0.16 to 0.20 range. Of interest is that zFIP projects future FIP better than actual FIP does. To my mild surprise, it also projects Statcast’s future xERA better than actual xERA does.
Can these numbers be used as projections by themselves? You can, but it’s not recommended. Actual results do help us project future results more accurately when they’re part of the equation. But numbers like these should be looked at as leading indicators of what’s to come.
Dan Szymborski is a senior writer for FanGraphs and the developer of the ZiPS projection system. He was a writer for ESPN.com from 2010-2018, a regular guest on a number of radio shows and podcasts, and a voting BBWAA member. He also maintains a terrible Twitter account at @DSzymborski.
Thank you Dan, very zCool!
Seems like a lot of charts end up being guys who are doing well are likely to regress and guys who are doing poorly are likely to get better. Of course that is an oversimplification, but the best part of it to me at least is finding underperformers who could be buy low candidates, or even guys who might be on the waiver wire. Obviously Means isn’t any of those, but the numbers are still great, so he probably isn’t a sell high candidate either. Lynn is someone who has not looked the same since he came back from the IL, and while getting results and not giving up runs has stopped missing bats and velocity is down, probably a sell at this point. Eovaldi is probably a target who could be had for cheap.
Anyhow good exercise. I know this isn’t a fantasy article per se, but I’m sure lots of us are looking at it that way. Thanks.
wow just coming at brad pennington real hard. ice cold, dan
Amazing what’s going on with the Angels SPs. I was looking at SIERRA, FIP, xFIP the other day and noticed they had multiple SPs underperforming. zFIP really drives that home.
In the past when multiple SPs on the same team were drastically underperforming predictive ERA estimators i’ve found that there was either an issue with team defense or the pitch sequencing was too predictable. Any daily Angels observers have any insight?
Angels fan here. Check out the team’s defensive numbers. They’re horrible.
Tonight’s game against the A’s will give you some insight. The Angels bullpen played their two favorite games: Inherited Runners Score Always and No Lead Is Safe. They played the first game in the sixth inning when Maddon pulled Quintana with one out, the score 1-1, and two runners on. Mayers, the first reliever out, let both runners score, giving Oakland a 3-2 lead and boosting Quintana’s in-game ERA from 1.69 to 5.07. After the Angels took the lead in the bottom of the sixth, the relievers gave us a bonus performance of the second game, losing the game 8-4.
I am present for the Julio Urias breakout. As much as the Dodgers under Friedman just bug me, that guy’s a beast on the mound. Loved how dominant he was in the playoffs last year
Nice to see Kyle on that HR list. Despite all he’s done, still the most underrated pitcher in baseball
How does Friedman bug you? By assembling one of the best teams in baseball, year in and year out?
probably. its very annoying for us fans of other NL teams.
Luis Castillo 3.07 zFIP? brb
So many Cardinals on both sides of the ledgers.