Position Players Pitching Is Back on the Rise
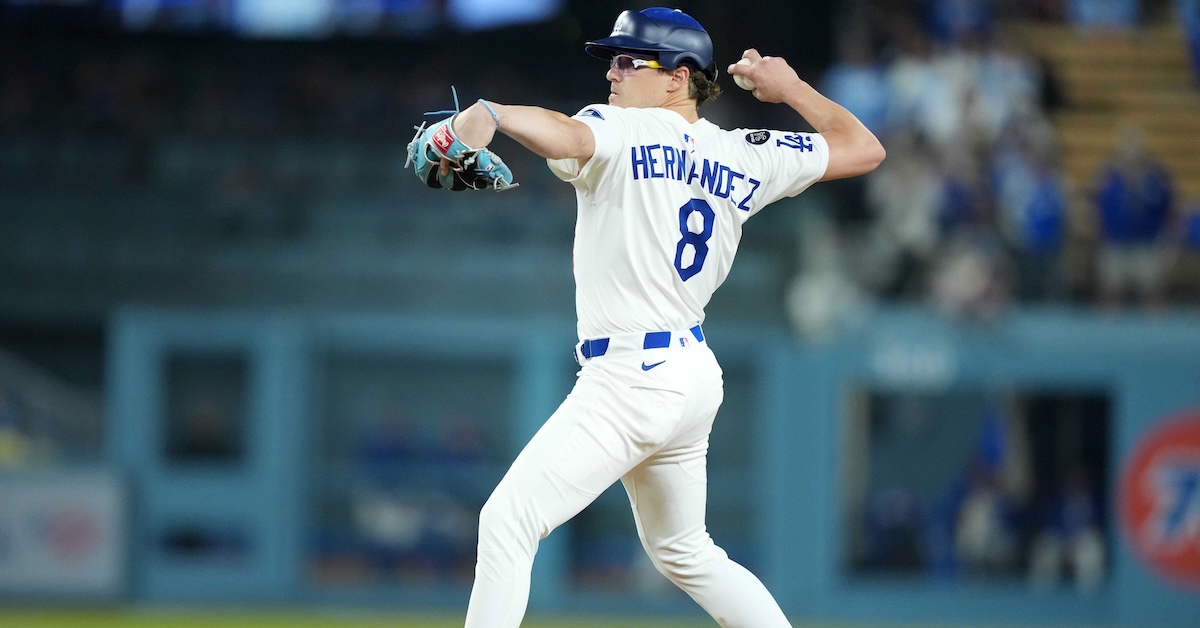
It’s no secret the Dodgers have been hurting for pitching because, well, their pitchers have been getting hurt. As during last October’s championship run, at times they’ve resorted to bullpen games, including a couple with Shohei Ohtani serving as an opener while rebuilding his pitch count following UCL reconstruction surgery. Taking a page from previous seasons under manager Dave Roberts, they’ve also snuck in a handful of innings from position players, not only when they’ve been on the short end of blowouts, but when they’ve led. Enrique Hernández has pitched five times, four in games in which the Dodgers thrashed opponents. Even with tighter rules in place for when teams can hand the ball to position players, the trend is nearing its height in popularity again following a recent dip.
It’s been nearly three years since I checked in on the trend of position players pitching. What was once a fun little beat to cover became less enjoyable as the practice proliferated to the point that Major League Baseball had to codify when teams could do it. Thankfully the occasions themselves are still appropriately light-hearted, full of giggles, eephus pitches, and batting-practice fastballs.
Here’s the evolution of the trend over the past decade, expressed as a percentage of total relief appearances:
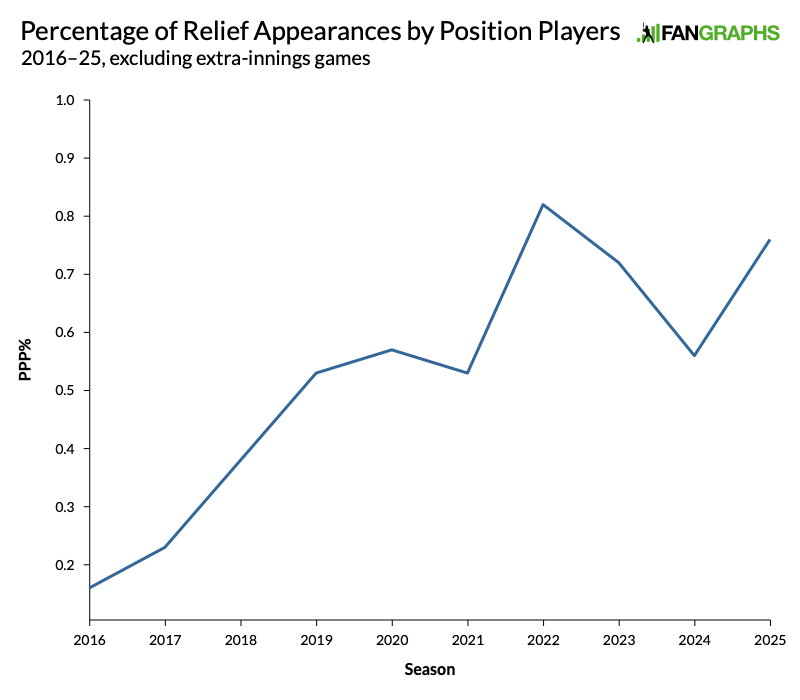
Note that this count doesn’t include extra-innings games, which particularly before the 2020 introduction of the so-called “Manfred Man” could extend for a ridiculously long time — to the point that a position player might take the ball once a manager burned through the rest of his staff. Here’s the data underlying the above graph:
As Share of Total Relief Appearances
| Season | PPP | PPP% |
|---|---|---|
| 2016 | 24 | 0.16% |
| 2017 | 36 | 0.23% |
| 2018 | 62 | 0.38% |
| 2019 | 88 | 0.53% |
| 2020 | 34 | 0.55% |
| 2021 | 88 | 0.53% |
| 2022 | 131 | 0.82% |
| 2023 | 114 | 0.72% |
| 2024 | 88 | 0.56% |
| 2025 | 61 | 0.76% |
From 2016 to ’18, the rate of PPP appearances more than doubled, and it continued to rise, with a localized peak during the pandemic-shortened 2020 season. That peak happened as Major League Baseball and the Players Association agreed to waive a couple of rules that had been introduced in February, one that limited teams to carrying 13 pitchers on their 26-man rosters and another that limited them to using position players to pitch only in extra innings, or in games where the score margin is more than six runs. Somewhere between MLB’s announcement of the rule and the publication of that year’s official rulebook, the language was revised to include score margins “equal to or more than” six runs. The waiver continued through 2021 and into the start of the ’22 season, which was delayed due to the owners’ lockout. Teams were allowed to carry 28 players through May 1, after which rosters were reduced to 26; at that point the six-or-more-runs requirement finally went into effect, but not until May 30 were teams limited to 13 pitchers on the 26-player roster.
Given the expanded rosters, just seven position players pitched between Opening Day and May 1, 2022, but once rosters were trimmed from 28 to 26, even with the six-or-more-runs rule, the floodgates opened, with 124 more PPP appearances through the rest of the season. The record-high seasonal rate of 0.82% of relief appearances made by position players was more than double what it had been in 2018 and more than five times what it had been in ’16. The rules were revised for 2023, limiting PPP appearances in the ninth inning or earlier to those where a team trailed by eight or more runs, or, for the ninth, leading by 10 or more runs; even then, the rate of PPP appearances was higher than it had been in any year prior to 2022.
Though the rules governing PPP appearances haven’t changed since then, the fever broke somewhat last year, with the rate back in the ballpark of 2019–21 levels. This year, it’s back up, higher than any season except 2022. That’s despite scoring levels being at their lowest for the three-year period (4.34 runs per game, compared to 4.39 last year and 4.62 in 2023). As Baseball Prospectus’ Patrick Dubuque observed in mid-May, we’re seeing more blowouts than usual, as measured by the standard deviation in score margin; updating his numbers, the SD of 2.89 is slightly behind that of the shortened 2020 season (which we can reasonably throw out) and tied with what it was in 2000 for the highest since 1939. The share of games decided by eight or more runs — in other words, those in which a position player could pitch for a trailing team under the latest rule change, fell from 9.5% in 2023 to 8.8% last year, but is back up to 9.3% this year. Even with the epic futility of the Rockies (18-63 overall, and 1-9 in games decided by eight or more runs), I don’t think that’s enough to account for the spike in usage, but it is worth noting.
Make no mistake, these position players are pretty bad at pitching:
| Season | G | IP | K% | BB% | HR/9 | ERA | FIP |
|---|---|---|---|---|---|---|---|
| 2021 | 88 | 78.3 | 5.2% | 7.0% | 2.99 | 8.16 | 8.01 |
| 2022 | 131 | 131.3 | 2.6% | 7.7% | 3.29 | 10.07 | 8.77 |
| 2023 | 114 | 114.3 | 2.9% | 6.2% | 3.07 | 10.15 | 8.37 |
| 2024 | 88 | 91.3 | 1.1% | 9.4% | 1.48 | 7.59 | 6.57 |
| 2025 | 61 | 68.7 | 2.6% | 8.8% | 2.10 | 11.01 | 7.30 |
This year’s ERA is the second worst for all the seasons I’ve tracked going back to 2013. It was 11.71 in 2018, with a 9.51 FIP, albeit in an aggregation that did not omit the extra-innings guys, which is why I chose not to republish my pre-2020 data.
Hernández, the Dodgers superutilityman, postseason hero, and community spokesman, is a frequent practitioner of the PPP phenomenon, bringing his particular band of jocularity to the occasion. In his first appearance of the season, on April 29 against the Marlins, he became the first pitcher to wear MLB’s approved hybrid protective helmet/cap in a game (a contraption initially designed for Bobby Miller, who was concussed by a comebacker during spring training), and made some quirky statistical history as well:
Kiké Hernández of the @Dodgers is the only MLB player in the modern era to score multiple runs, play multiple positions and have a scoreless outing on the mound all in a game he did not start. pic.twitter.com/xkmBGnb1mE
— OptaSTATS (@OptaSTATS) April 30, 2025
Hernández threw a scoreless inning in the Dodgers’ 15-2 rout that night, but the returns have diminished as Roberts has called upon him with increasing frequency — four times since May 31. During a June 10 loss to the Padres, he threw the longest PPP outing of the season, going 2 1/3 innings. But his last two appearances have backfired. On June 14, a game in which the Dodgers led the Giants 11-0, he finally recorded a strikeout in his eighth career appearance, as the Giants’ Christian Koss looked at an 87-mph fastball in disbelief, but that was one of just two batters he retired out of nine faced; he was charged with five runs and had to be relieved by Anthony Banda. This past Sunday against the Nationals, he entered with the Dodgers leading 13-3 in the ninth, retired just one of six batters faced, and was charged with four runs; Alex Vesia had to record the final two outs. Hernández is now carrying a 15.19 ERA and 9.51 FIP in 5 1/3 innings this year. He is tied with the Brewers’ Jake Bauers (who has a 3.60 ERA and 5.67 FIP) for this year’s lead in PPP appearances with five, and is seventh in such appearances since the start of 2016:
| Player | G | IP | K% | BB% | HR/9 | ERA | FIP |
|---|---|---|---|---|---|---|---|
| Hanser Alberto | 14 | 14.0 | 3.0% | 9.0% | 2.57 | 7.07 | 8.28 |
| Kody Clemens | 12 | 10.2 | 3.7% | 9.3% | 0.84 | 4.22 | 5.40 |
| Christian Bethancourt | 11 | 9.2 | 6.9% | 20.7% | 2.79 | 9.31 | 10.38 |
| Chris Gimenez | 10 | 10.0 | 4.0% | 2.0% | 4.50 | 14.40 | 9.55 |
| Enrique Hernández | 10 | 10.0 | 1.7% | 16.9% | 1.80 | 12.60 | 8.52 |
| Luke Maile | 10 | 11.0 | 5.4% | 0.0% | 4.91 | 12.27 | 10.03 |
| Mike Brosseau | 10 | 9.2 | 2.4% | 4.9% | 1.86 | 2.79 | 6.61 |
| Hernán Pérez | 9 | 9.1 | 11.9% | 9.5% | 1.93 | 5.79 | 6.50 |
| Jacob Stallings | 9 | 11.0 | 4.3% | 0.0% | 0.82 | 4.09 | 4.58 |
| Harold Castro | 9 | 8.2 | 2.5% | 12.5% | 0.00 | 4.15 | 5.36 |
| Jake Bauers | 9 | 9.0 | 4.1% | 14.3% | 0.00 | 4.00 | 5.67 |
The 29-year-old Bauers, who hadn’t pitched since little league, is the fast riser on this table, with all nine of his appearances coming in the past two seasons. “I found myself on the mound the last couple times out, like, literally thinking to myself, ‘These guys can’t hit you,’” he said recently. “That’s ridiculous to say out loud, but I don’t know, there’s kind of an attitude that comes with it.”
Not on the table yet, but making tracks as well is the Twins’ Jonah Bride, whose four pitching appearances have all happened this month.
As for the trend of PPP appearances in leads, excluding extra-innings games, only five times did a position player pitch in a victory from 2016–21, a count that included one player facing a single batter as part of a nine-position stunt (the Tigers’ Andrew Romine in 2017), three by the Dodgers’ Russell Martin (all in 2019, his final year in the majors), and one by the Angels’ Jared Walsh (also 2019) during his short-lived attempt to make it as a two-way player. In 2022, the total skyrocketed to 18, with the Dodgers’ Alberto accounting for eight of those appearances himself (and 10 total, including losses); the count also included the Cardinals’ Yadier Molina and Albert Pujols. The frequency of PPP appearances on the winning side in blowouts is now at its highest rate since the 10-run rule went into effect, more than triple last year’s rate:
Share of Position Player Relief Appearances
| Season | PPP_W | PPP_W% |
|---|---|---|
| 2017 | 1 | 2.8% |
| 2019 | 4 | 4.5% |
| 2022 | 18 | 13.7% |
| 2023 | 9 | 7.9% |
| 2024 | 3 | 3.4% |
| 2025 | 7 | 11.5% |
The Dodgers account for 16 of the 42 total PPP non-extra innings appearances in wins since 2017, followed by the Giants (six), and the Brewers and Cardinals (three apiece); no other team has more than two. Perhaps surprisingly, the Dodgers don’t have the most overall PPP since the start of 2016; their total of 34 is seventh, behind the Twins (39), Brewers and Cubs (37 apiece), Diamondbacks and Tigers (36 apiece), and Reds (35). The Rockies (12), Braves (13), Yankees (14), Blue Jays and Guardians (15 apiece), and Mets (16) bring up the rear.
I know it’s easy to complain about the bad look that comes with using position players to pitch on either end of lopsided games; we all like to yell at the occasional cloud. Still, even with the tighter rules, the usage itself is less a problem and more a symptom of larger issues — competitive balance, reliever usage, roster rules — that the game hasn’t solved. We can fret about all of those things while still enjoying the occasional eephus.
Brooklyn-based Jay Jaffe is a senior writer for FanGraphs, the author of The Cooperstown Casebook (Thomas Dunne Books, 2017) and the creator of the JAWS (Jaffe WAR Score) metric for Hall of Fame analysis. He founded the Futility Infielder website (2001), was a columnist for Baseball Prospectus (2005-2012) and a contributing writer for Sports Illustrated (2012-2018). He has been a recurring guest on MLB Network and a member of the BBWAA since 2011, and a Hall of Fame voter since 2021. Follow him on BlueSky @jayjaffe.bsky.social.
I do wonder if actually having a rule on this in some way encourages PPP (I know the rates were increasing dramatically pre the rule, but that actual times you’d be ok with having a position player pitch probably isn’t too much higher than the 2022 peak.) Having the situations when you are allowed to have a PPP enshrined in the rules might make some managers go, perhaps subconsciously, “Ah, I’m allowed to put in a position player now.”