Reaching Back for a Little Something Extra
Hello there! Here’s a graph.
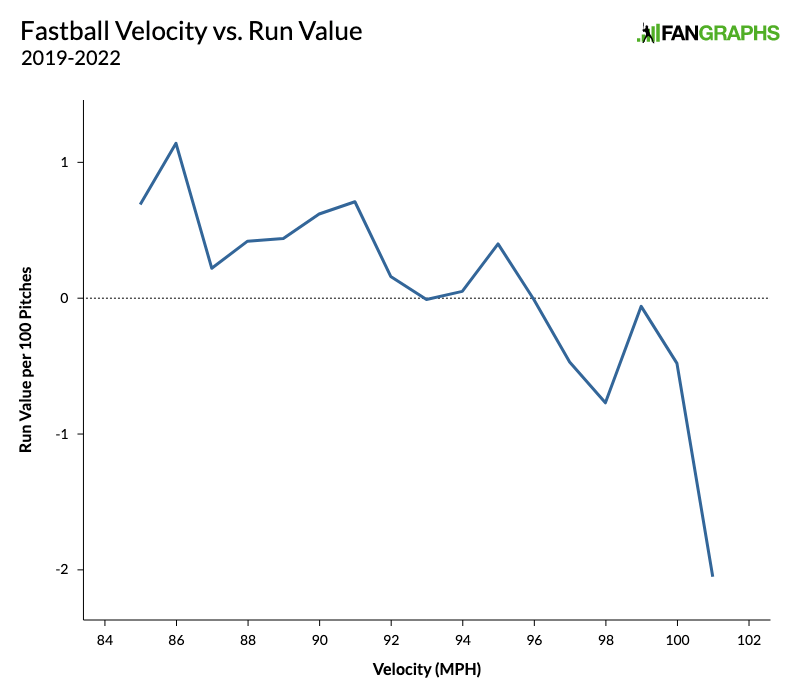
Were you not geared up for such a quick graph? Did I blow it right by you? That was kind of the point. The graph shows the run value of fastballs, bucketed in 1-mph increments. Over the past four seasons, for every 100 fastballs thrown, one tick of velocity has been worth roughly an eighth of a run. The lesson? Throw your fastballs fast.
I’ll stick to fastballs in this article, but I should mention that harder soft stuff is also associated with better outcomes, though the correlation is weaker and the effect is less dramatic. My number crunching indicates that over 100 breaking and offspeed pitches, an extra mile per hour is worth roughly 1/16 of a run.
Increased velocity has been a big story during the postseason. This year, the average regular season fastball was 93.1 mph; so far the average postseason fastball is 94.4 mph. There’s some selection bias here, but it doesn’t make up all of the difference. If you weight the 5,787 postseason fastballs by the regular season velocity of the pitcher who threw them, you’d expect the average postseason fastball to be 94 mph even. This article is about the extra 0.4 mph.
I pulled average fastball velocity for the 133 pitchers who have thrown fastballs during the postseason. Thirty-nine pitchers threw slower in the postseason, 88 threw harder, and 10 had velos exactly the same as their season average. In the postseason, pitchers have thrown their fastballs an average of 0.32 mph faster than they did in the regular season. The median pitcher threw 0.4 mph faster. Ninety-six of the 133 pitchers were within one standard deviation, or 0.94 mph, of their regular season average.
As a note, these averages are no longer weighted on a per pitch basis. I just want to know who’s throwing harder overall, so pitchers are weighted the same whether they threw 10 fastballs or 100.
I pulled some other samples to make sure this effect was real. It occurred to me that maybe these pitchers were throwing harder toward the end of the season anyway, so I pulled their average velocities in September and October and compared them to their averages over the entire regular season. Nothing there. They were nearly identical on average (as were the averages for pitchers league-wide). People are just throwing harder in the postseason.
The obvious hypothesis is that adrenaline is supplying the extra velocity. When the lights shine the brightest, the pitchers throw extra hard.
I tried two ways to test that theory. First, I pulled information only from the first inning. This captured starting pitchers almost exclusively (thanks a lot, NLCS Game 4), specifically in situations where fatigue wouldn’t be a factor. I suspected that this would also emphasize nerves, as the pitchers didn’t have time to adjust to the moment and find a rhythm. The downside was that it reduced the sample to just 29 pitchers, but their velocity was up an average of 0.74 mph over their regular season first inning velocity, which is certainly convincing.
The second test was to compare postseason velocity to high-leverage regular season velocity. My thinking was that the pressure of the playoffs might be similar to the pressure of a big moment in the regular season. It turned out to be true. Our sample of pitchers threw their fastballs harder depending on how many runners were on base. With the bases loaded, they threw an average of 0.14 mph harder than they do in the playoffs. Playoff pressure is big, but it’s not bases loaded big.
So what’s the regular season base state that causes pitchers to throw as hard as they do in the postseason? It’s a runner on third, with nobody on first or second. If we allow ourselves to infer adrenaline levels from fastball velocity, then we can say that the all of the pressure and hype and buildup of the playoffs is akin to having a guy on third on a regular Tuesday in Milwaukee.
Below is a table of the pitchers who were furthest above or below their regular season average, broken down by individual fastball type:
| Player | Pitch | Playoff Velo | 2022 Velo | Difference |
|---|---|---|---|---|
| Pete Fairbanks | 4-Seam | 95.2 | 99 | -3.8 |
| Sean Manaea | Sinker | 94.9 | 91.2 | 3.7 |
| Kyle Gibson | Sinker | 94.9 | 91.6 | 3.3 |
| Kyle Gibson | 4-Seam | 95.1 | 92 | 3.1 |
| Adam Ottavino | Cutter | 84.8 | 87.8 | -3 |
| Robert Suarez | Cutter | 96.4 | 93.6 | 2.8 |
| Luis Garcia | 4-Seam | 96.8 | 94 | 2.8 |
| Kyle Gibson | Cutter | 91.9 | 89.4 | 2.5 |
| Matthew Boyd | Sinker | 93.1 | 90.6 | 2.5 |
| Domingo Germán | 4-Seam | 95.2 | 92.7 | 2.5 |
| Brooks Raley | Cutter | 85.6 | 88 | -2.4 |
| Adam Ottavino | 4-Seam | 92.4 | 94.8 | -2.4 |
| Wandy Peralta | 4-Seam | 93.1 | 95.4 | -2.3 |
It’s worth noting that a few of these players only threw the pitch in question once or twice. As for the two big outliers, something was clearly off with Pete Fairbanks. You might remember his first pitch in the Wild Card Series:
He left with a trainer after just 11 pitches, and it was later reported that he experienced numbness in his index finger.
On the other hand, Sean Manaea’s sinker velocity had been ticking up late in the season. It averaged 91.2 mph on the season overall, but it was at 92.4 in September. He averaged a season-high 94.5 mph during an appearance on September 10, so the difference was much more in line with his velocity level at the time.
Now for the fun part. Let’s focus on pitchers who will be in the World Series, beginning with Kyle Gibson.
| Player | Pitch | Playoff Velo | 2022 Velo | Difference |
|---|---|---|---|---|
| Kyle Gibson | Sinker | 94.9 | 91.6 | 3.3 |
| Kyle Gibson | 4-Seam | 95.1 | 92 | 3.1 |
| Kyle Gibson | Cutter | 91.9 | 89.4 | 2.5 |
Gibson’s velocity has been trending up since August. Combine that with playoff adrenaline and stuff playing up out of the bullpen, and you get an awfully large jump. Gibson had a 5.05 ERA and a 4.28 FIP in the regular season, so he might not see much work in the World Series. If he can keep sitting 95 with his four-seamer and sinker, however, it might be fair to consider getting him more involved.
| Player | Pitch | Playoff Velo | 2022 Velo | Difference |
|---|---|---|---|---|
| Luis Garcia | 4-Seam | 96.8 | 94 | 2.8 |
| Luis Garcia | Cutter | 87.2 | 85.3 | 1.9 |
| Luis Garcia | Sinker | 89.3 | 90.6 | -1.3 |
What with the Houston’s deep stable of righties, it’s not at all certain that Luis Garcia will pitch in the World Series either. He threw five brilliant, scoreless innings in Game 3 of the ALDS, and he was rewarded with a whole lot of rest in the ALCS. Garcia throws his four-seamer 42% of the time, so the fact that it’s playing up so much might help him if he does get in a game. He got it all the way up to 98.2 mph a couple times against the Mariners. Garcia only threw one sinker in the ALDS, so it’s probably not worth worrying about.
| Player | Pitch | Playoff Velo | 2022 Velo | Difference |
|---|---|---|---|---|
| Aaron Nola | 4-Seam | 94.2 | 92.8 | 1.4 |
| Aaron Nola | Sinker | 93.4 | 92.2 | 1.2 |
I couldn’t find anything other than the big stage to explain Aaron Nola’s increased velocity. His velocity was consistent throughout the year, and he didn’t begin his playoff starts strong only to come back to earth in the later innings. His four-seamer averaged 93.8 mph in the Wild Card Series, 94.3 in the NLDS, and 94.6 in the NLCS. Hopefully he keeps it going in the World Series.
| Player | Pitch | Playoff Velo | 2022 Velo | Difference |
|---|---|---|---|---|
| José Alvarado | 4-Seam | 99.2 | 97.8 | 1.4 |
José Alvarado’s four-seamer probably isn’t worth worrying about. He’s credited with throwing two in a row against Lars Nootbaar, but he hadn’t thrown one since May. It’s likely it was a misclassified sinker or a slightly desperate move in a full count.
| Player | Pitch | Playoff Velo | 2022 Velo | Difference |
|---|---|---|---|---|
| David Robertson | Cutter | 91.7 | 93 | -1.3 |
David Robertson’s changing velocity is part of a months-long trend. He throws his cutter just over half the time, and its velocity started trending downward in the summer, concurrent with a slightly heightened release point. It averaged 93.8 mph in July and 92 in September. The changes haven’t hurt his postseason performance thus far, but it’s worth keeping an eye on.
| Player | Pitch | Playoff Velo | 2022 Velo | Difference |
|---|---|---|---|---|
| Framber Valdez | Sinker | 95.2 | 93.9 | 1.3 |
| Framber Valdez | 4-Seam | 95.3 | 94.1 | 1.2 |
Framber Valdez has been lights out all year long, and he’s pitched to a 1.42 ERA and a 1.46 FIP in his two postseason starts. As Ben Clemens noted last week, the increased velocity on his sinker wasn’t necessarily leading to better results. The Phillies are surely worried about facing him regardless.
| Player | Pitch | Playoff Velo | 2022 Velo | Difference |
|---|---|---|---|---|
| Seranthony Domínguez | 4-Seam | 98.8 | 97.6 | 1.2 |
| Seranthony Domínguez | Sinker | 99.4 | 98.2 | 1.2 |
Seranthony Domínguez has seen his velocity increase in each month of the season. It took a hit in September as he worked himself back from a 15-day IL stint due to triceps soreness, but his playoff velocity is right back to where he was before the injury.
| Player | Pitch | Playoff Velo | 2022 Velo | Difference |
|---|---|---|---|---|
| Lance McCullers Jr. | Cutter | 87.3 | 88.3 | -1 |
We should be taking all of Lance McCullers Jr.’s numbers with a grain of salt, as he only made eight regular season starts this year, and during the second of his postseason starts, he was pitching through a mild case of champagne elbow.
| Player | Pitch | Playoff Velo | 2022 Velo | Difference |
|---|---|---|---|---|
| Zack Wheeler | Sinker | 96.4 | 95.4 | 1 |
Last but very definitely not least is Zack Wheeler. Wheeler’s postseason velo increase is due to a return to form after an IL stint for forearm tendonitis. He’s allowed five runs in four postseason starts, so right now no one is too concerned with what he did in the regular season. However, there was a definite trend in Wheeler’s postseason starts:
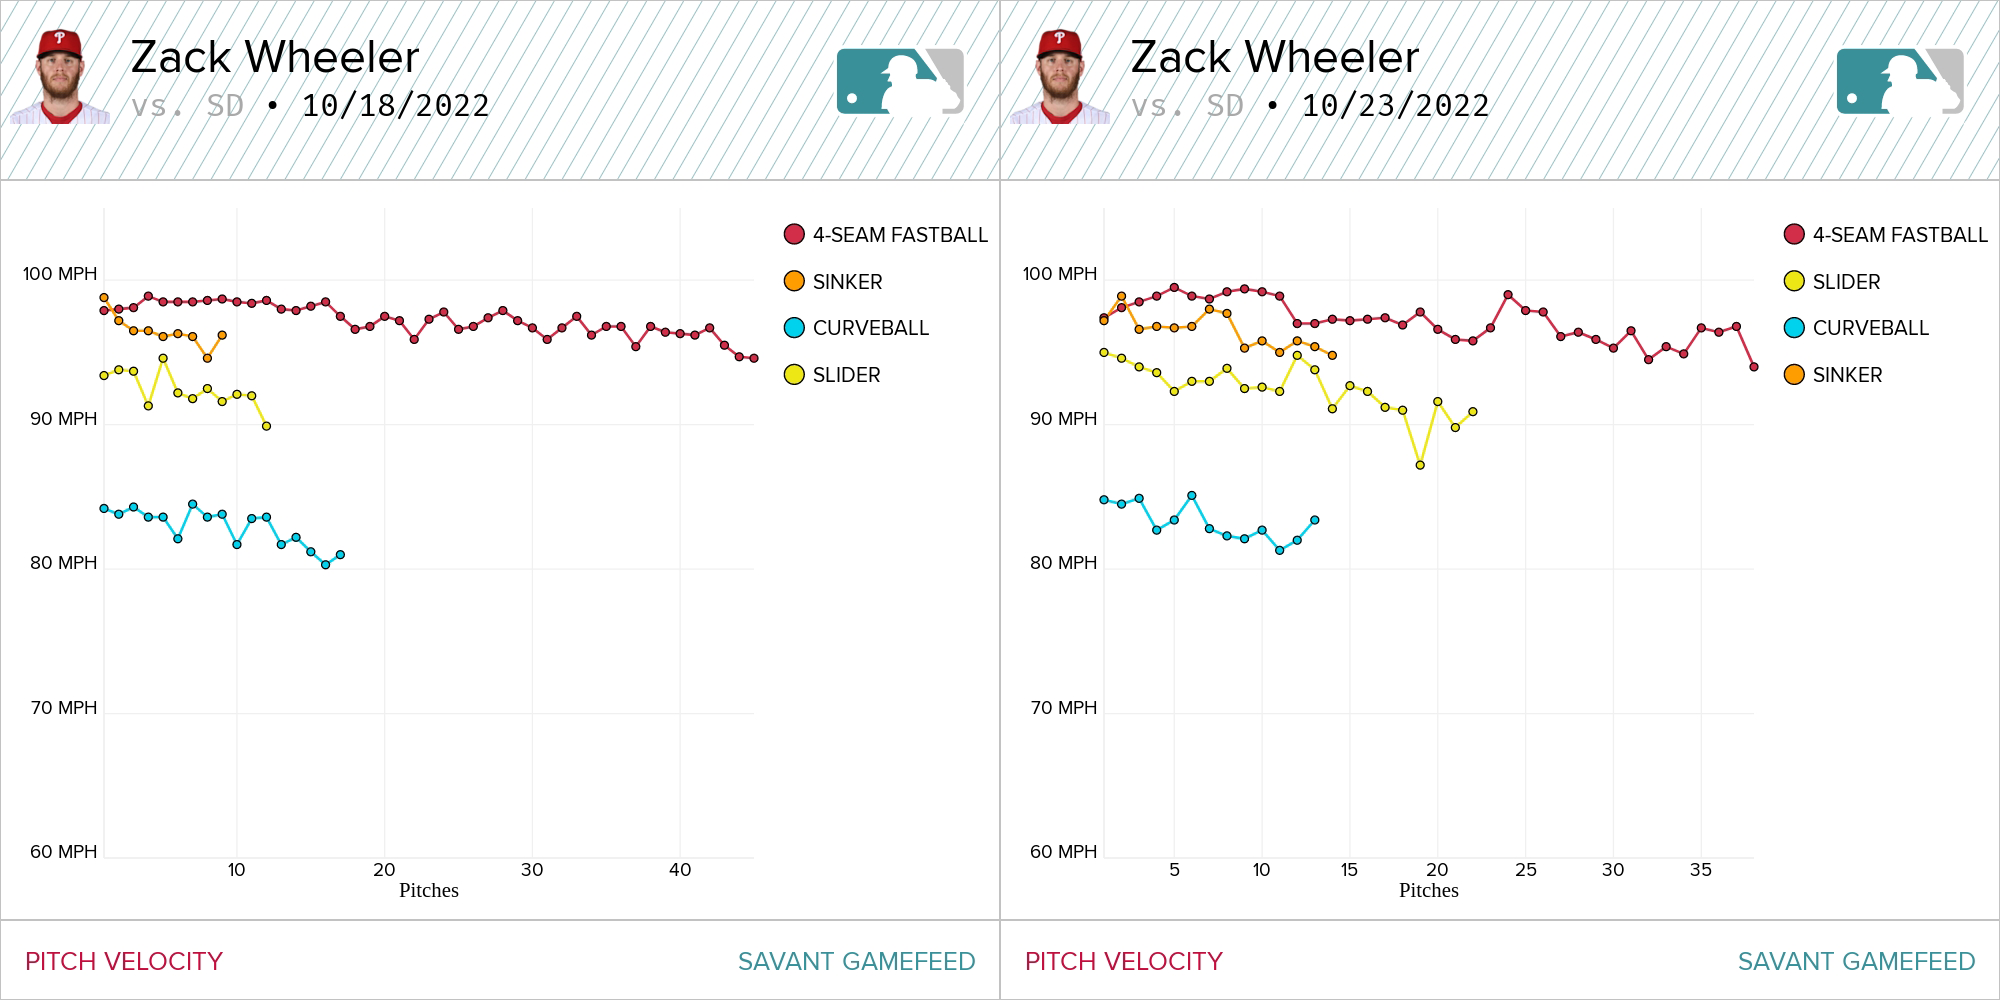
Wheeler’s velocity declined noticeably as the games went on, and the Phillies made sure to take him out before his performance had a chance to do the same. I’d expect that trend to continue.
As much fun as I had learning about pitchers who reach back and find something extra when the lights shine the brightest, it’s unlikely that the increased velocity will make a huge difference in the World Series. If you remember the graph at the very beginning of this article, an extra tick or two of fastball velocity is correlated with an eighth of a run saved over 100 pitches. If you prefer to look at wOBA, an extra mile an hour correlates to a reduction of .0078, enough to turn likely Silver Slugger winner Yordan Alvarez into…likely MVP winner Paul Goldschmidt.
All the same, you never know when the extra oomph is going to be the difference between a batter crushing a ball into the seats and just missing one for a loud out. It could happen when the game, or the whole season, is on the line.
Davy Andrews is a Brooklyn-based musician and a writer at FanGraphs. He can be found on Bluesky @davyandrewsdavy.bsky.social.
Love this deep look! I’m interested in doing a similar analysis but for home-to-1st running time in the playoffs and the influence on outcomes. Any advice on where I could get that data?
Thanks! I wish I knew where to get that data, but I’m afraid I can’t help you. If you figure it out, I would love to see it. It’s a really interesting topic.