Redrawing the MiLB Map: An Update
On Monday, we published a piece detailing how MLB’s proposal to reimagine the minor leagues would alter in-person access to professional baseball across the country. We were interested in how many people would lose their ability to watch affiliated baseball in person, or see that access shift from the minor leagues to more expensive major league parks. To arrive at those numbers:
[W]e took the geographical center of each ZCTA (a close relative of ZIP Codes used by the Census Bureau). We calculated the distance as the crow flies from each ZCTA to each ballpark in America, both in 2019 and in MLB’s proposed new landscape. From there, we took the minimum of all of those distances for each ZCTA. That gave us the shortest distance to baseball for each geographical center. We then matched the distance with the population of each area.
In the piece, we acknowledged the limitations of linear distance. It doesn’t account for natural barriers, like say, mountains or lakes, or things like the placement of roads. And, as several folks pointed out on twitter and in the comments, not all road conditions are created equally. How long it takes to drive 50 miles in the Washington D.C. metro area varies widely from how long that same distance takes in rural Montana. What’s more, residents of those respective areas likely view a 50 mile drive differently; if you have to travel a ways to go grocery shopping, your understanding of how burdensome a 100 mile drive to your “local” minor league ballpark is probably different than it is for someone who lives in a place with a meaningful rush hour and amenities that are closer at hand. So while linear distance is a good approximation of how the access landscape would change in the new minor leagues, we wanted to take a stab at being a bit more precise.
First, we looked at a closer band. We looked at areas losing access to any level of professional baseball within 25 miles. For this variation (and only this variation), our map includes major league and independent teams. Our reasoning is that while a fan making a 50 mile drive is committing to a good deal of travel time and might reasonably prefer a very specific form of entertainment (a particular team, level of affiliated ball, etc.), a fan hopping on a bus or making a 15 minute drive to the ballpark might be more flexible, as their time investment is lower. The regions losing access to that nearby baseball look like this:
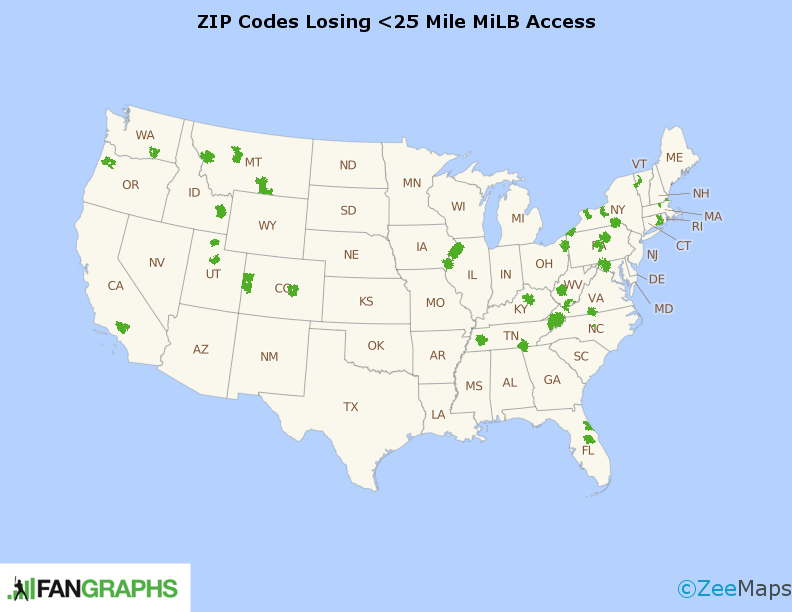
That more closely depicts the situation in New England and the northeast in general. It doesn’t handle the western half of the US all that well, though. To account for that, we also looked at a variable distance method. We assigned a maximum driving distance to each state to account for differing driving preferences. Montana, for example, has a 100 mile maximum, as populations and amenities are more spread out on average. Connecticut has a 35 mile maximum. Kentucky is somewhere in between, with a 75 mile maximum driving distance. This map, unlike the first one, only looks at minor league stadiums:
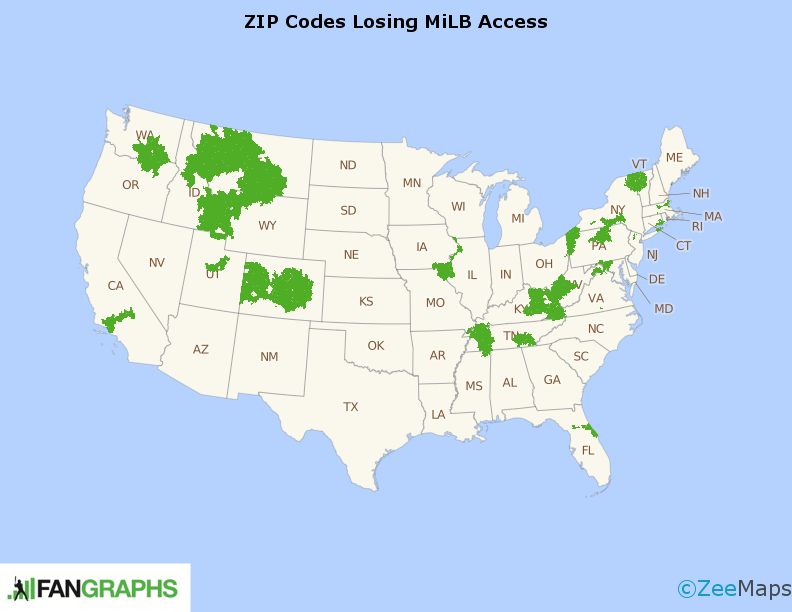
The number of people losing access to live baseball by these two definitions is still quite large. Depending on your criteria, as many as 16 million people are affected:
| Miles | MiLB Now | Proposed MiLB | MiLB/MLB Now | Proposed MiLB/MLB | All Pro Ball Now | Proposed Pro Ball |
|---|---|---|---|---|---|---|
| <25 | 172.3 | 187.5 | 112.2 | 124.2 | 101.3 | 112.8 |
| Dynamic | 71.1 | 87.5 | 40.9 | 50.6 | 34.5 | 43.2 |
This method is still imperfect. It doesn’t account for variations within a region, as we are approximating travel distances with a broad brush. It doesn’t account for public transit maps; a 45 mile journey by commuter rail to a stadium might be completely acceptable, while a similar 45 mile journey not on the rail path might take hours due to traffic. We still can’t account for inefficient roadways and natural barriers, and we aren’t modeling the impact of traffic, the presence of which might inspire many a would-be baseball fan to stay home, no matter how close the park. But tolerable driving distances are contextual, and this new analysis attempts to account for that.
This map also assumes ready access to either a car, or workable public transit or bike routes, the latter two of which might be hard to come by, particularly in the rural communities Allison McCague highlighted in her piece at Baseball Prospectus. A 45 mile trip might be simple for someone who lives near a commuter rail or reliable regional bus line, while a 45 mile trip to the same park could prove prohibitive in a region with no access to transit. Transit access is an issue all its own, and one unlikely to be solved by MLB (though the league and its teams can certainly do their part by making easy access to public transit a priority in the selection of new ballpark sites). Still, we think is important to acknowledge, especially if we’re assuming a variable understanding of what is “close” when considering how accessible affiliated baseball is.
There are other, worthwhile avenues of research that have their own understandings of access, too. For instance, our initial mapping project accounted for minor and major league baseball facilities, as well as those of the Independent Leagues, but it doesn’t take into account college programs. That omission is defensible in an analysis of the access to pro ball, but the Vandy Boys might want a word with us. And you might also wish to build an even more nuanced version of the pro landscape, one that accounts for regions in a different way or considers different maximum driving distances.
Should you wish to perform further permutations, you’re in luck. If you’re comfortable with our three choices of stadium set (MiLB, MiLB/MLB, and all pro ball), you can look at the raw data for population and distance to baseball here. This dataset is the output of our minimum distance algorithm for each ZIP code under those three conditions, and accounting for the proposed stadium closures. If you’d like to add your own stadiums, you’ll need to recalculate the minimum distance yourself, but you can find the longitude and latitude of each ZIP code in the linked dataset, and our own database of approximate longitude and latitude for all professional stadiums here. From there, you’d merely need to add the extra stadiums and re-run a minimum distance algorithm on your new data.
We’re glad to have the opportunity to refine our work, and hopefully help others with theirs. As MLB and MiLB contemplate the future of the minor leagues, there are a lot of questions that have to be answered. We hope that this piece brings a bit more precision to this one.
Meg is the managing editor of FanGraphs. Ben is a contributor to FanGraphs.
Very informative followup. Thanks. As you noted, if having access to baseball is the key concern, then I think we need to add other non-professional outlets to the equation, especially because half of the affiliates being eliminated are short season Rookie leagues, which are really just a step up (if even that).
If MLB breaks 40 affiliates and does nothing else, then the costs of the plan could eat at the benefits (which, from a player development standpoint, are real). However, if MLB more actively infests in rural/remote areas by supporting things like college leagues, high school programs and youth programs, the impact on those communities may be more meaningful.
Well you at least have one word right – MLB infests. That’s it.
Break the anti-trust exemption. Period
Form an actual sports governing body that excludes MLB
Let the lawsuits fly.
I’m sure the MLB billionaires can figure out their best infestment strategy from there.
Thank you for covering this topic. Not sure if you know but I haven’t been able to figure out what the 30 AA teams will be.
Reports have 4 cuts:
2 Eastern League (Binghamton, Erie)
2 Southern League (Jackson, Chattanooga)
I can’t figure out a way to back fill that makes sense. Here’s as close as I can get:
1) Brooklyn for Binghamton
2) St. Paul Saints and Sugar Land Skeeters are added to affiliate ball in the initial reports. St. Paul as AAA Twins affiliate, dropping someone (Rochester?) to Eastern League for Erie.
3) Sugar Land Skeeters to AA Texas League who also adds…
4) who else?
Texas League grows by 2 and SL shrinks by 2?
Has anyone else seen reports or tried to figure this out?
Reporting I have seen has St. Paul and Sugarland entering PCL, with two teams from that league moving to either AA or creating a domino effect that ends with two new teams at AA level. Also, the Cyclones and Bowling Green Hot Rods have been rumored as AA additions. Ultimately, this is a very fluid plan, and the final implementation is likely to look very different from the initial proposal.
This is my question as well. St. Paul is too close to the Twins and Sugarland is too close to the Astros. The Gwinnett Stripers, too close to the Braves, were 87th in average attendance this season finishing far behind even teams in the lowest levels of organized ball. Connecticut has two Double-A quality stadiums that are presently being used by teams that are either not affiliated, New Britain which hosted the Twins AA team for over 20 years, and Norwich, whose NY-Penn League team is scheduled for contraction, has a very nice park with a capacity of 6,500. Rather than spend money on new facilities these seem like reasonable choices.
It’s important to remember that all reports about St. Paul and Sugar Land entering affiliated ball are from affiliated sources. In the case of St. Paul they would not benefit in any way from a move to affiliated ball. They already make more money, draw good attendance numbers, and have a super successful indie business model. I’m inclined to trust the unaffiliated sources that say they see St. Paul turning down any offer of affiliation.
I live the city over from Shelbyville, and I would echo the comments that the Saints unlikely to accept an offer of affiliated ball. Rochester, MN, always made sense to me as an option for our Triple-A affiliate. The metro area down there has a population of just over 200K, the Mayo Clinic is there which I could see some kind of sports science collaboration, and it is located in the South of the state, which would make it a bit closer for PCL distances, but still close enough to pull a reliever at 3pm and have em at the stadium in 90 minutes drive. St-Cloud also would make sense, as would possibly Winona, or even across the boarder in Eau Claire.
I’ve been to three minor league parks in the DC area, and none of them had legitimate public transportation options. And that’s in DC. My guess is very few minor league parks are all that accessible by public transportation. It makes a certain amount of sense. You need a lot of land for what is not a very high grossing product. The convenience of good public transportation drives up real estate costs.
At the same time, the idea that it would be normal to drive 75 miles for someone in Kentucky is highly questionable. Is that 75 miles round trip? Even that seems high.
75 miles is nothing. Thats 1 hr drive in these places in question. This isn’t manhatten.
For many, a 1 hour drive and the gas involved in such a drive is very much something.
I’m from Appalachia (Tennessee). People don’t just get up and drive 75 miles. And it’s not 1 hour. Roads in “these places” have curves and hills and there are actually stoplights. Thinking of it as Montana-light is silly.
Rarely is anyone from the Tri Cities going to drive down for a Tennessee Smokies game – it’s too far.
The one scenario I haven’t seen mentioned is what happens with future expansion? Let’s say MLB puts franchises in Portland/Montreal (or two cities of your choosing) within the next five years. Now you’ve got to add 8-10 MILB teams. Do you steal back stadiums from this fairy tale “Dream League?” And can you imagine the situation for local ownership and sponsors: “Our bad! You get to be an affiliate again, until we arbitrarily make new rules! Good luck!”
MLB’s floated “rationale” is that the targetted teams play in substandard facilities.
The purpose of this proposed contraction might be to secure new facilities in the upcoming negotiations.
Or…
There is another proposal afoot that comes to mind from the article charts: 100m without easy access to live baseball? A third of the country? That’s a lot of money, er, people…
MLB is considering a dual move of lifting the streaming video blackout restrictions while allowing teams to sell single team streaming subscriptions.
Nationally.
With 10% of people having ditched cable and the cordcutting showing signs of accelerating and other content owners (Disney, WB, Comcast, Universal, etc) decoupling from the cablecos, MLB may be looking to start to prepare for a future without RSNs. And against that, any decline in live minors might be in their eyes an incentive to sign up for streaming.
Fans hanging on to cable or close to live baseball might be reluctant to switch to streaming but those further out might be easier sells and serve to ramp up the new distribution paradigm.
These kinds of moves don’t happen in a vacuum; somewhere there’s an ulterior motive.
The new digital media agreement between owners does not lift blackouts nor does it allow teams to sell streaming rights nationally. Rather, it returns in-market streaming rights back to the clubs. How that will manifest has yet to be revealed, but there is no rational connection between streaming rights and affiliation contraction.
Appalachia gets hit hard
Bozeman MT will be a long drive away from a minor league team.
(Chadwick) Boseman (of Brooklyn NY) will still be close to the cyclones.
As a avid fan of minor league baseball for many, many years I feel somewhat qualified to venture an opinion. Let me say to begin that I am bent out of shape by this money grab by Manfred and his co-conspirators. Where I live in central Connecticut, there has been Double-A baseball for as long as I can remember. The Indians had a team in Waterbury, 15 minutes from home, in the 60’s that played in a “ballpark” that would make Hagerstown’s dump look good. The Red Sox franchise moved to Bristol, 20 minutes away, in the early 70’s. I watched Jim Ed Rice play there in another converted high school field then New Britain built a decent field, hardly a stadium, that opened in 1983. That was replaced by a true stadium about 10 years later. Less than 10 minutes from my home, I was a regular and after retiring I got a half-season ticket. Mauer, Morneau and some guy named Ortiz all came through New Britain and so did the rising stars of the rest of the Eastern League teams. In all fairness, the franchise was getting tired and the owners swindled the city of Hartford into building a state-of-the-art park in downtown Hartford. It is a great place to watch a game and the access isn’t too bad, but that is relative. Even though it is still only 20 minutes away, trying to drive into a major city during rush hour is always a crap shoot so instead of being a regular, I saw exactly 5 games this year and actually watched the Connecticut Tigers more often. As for the ballpark that is 10 minutes from my home, I have not gone to a game since the Rock Cats left, the Atlantic League has had a team there, because there is no affiliation with any major league team. I love baseball but I am not interested in players who most likely will never play a game in the show in the future. I think that most fans of minor league baseball relate to the affiliation with the major leagues clubs and most will not support independent leagues in anything close to the way the minors are presently structured. I am a fanatical Red Sox fan but it made no difference to me who the Rock Cats were affiliated with as long as it was a major league club because I was there as a fan of baseball. I will not be affected as much by this as I was by the Rock Cats leaving but I feel for the fans who live in Jackson, TN or Binghamton, NY who will lose a strong connection to the game. As I write this I am wearing my Greensboro Grasshoppers cap which just happens to be the best Low-A ballpark I have been to out of the 64 parks I have visited, both major and minor league since I first stepped into Fenway in 1948. I echo so many who see this as nothing more than a money grab and it cannot help grow interest in the game in any way.
Care to redraw the map one more time? Michael Silverman of the Boston Globe has a report stating that only 13 teams would actually be eliminated, while the others are converted to the Dream League or college summer leagues (I’d post the link, but they often get stuck in moderation). Based on my map, it would significantly reduce the zip codes that lose access to baseball. Granted, the Dream League and college summer leagues may not be exactly the same as the affiliate, but for the most part, the step down would be from short season Rookie ball, so the gap might not be that great.
I think I answered that in my previous blog. I am quite sure very few fans will go to games in which the teams are not affiliated with a major league team. When I watch the Hartford Yard Goats play the Portland Sea Dogs I am anticipating seeing Brendan Rodgers or Bobby Dalbec playing for their parent clubs in just a year or so. That attachment does not exist in these fake leagues that Manfred is trying to pass off as substitutes. It will not succeed!
You may be vastly overstating how much your experience and thought process translates to the general MiLB watching public.
Pricing, good operations, and variety of entertainment may be way more important for sustaining any inferior baseball product.