Research – Home Runs & Fly Balls
I thought I'd try something a little different today and write about some research I've been doing on home runs and fly balls. Most of this research was spurred by a good discussion that's ongoing in our forums section between Russ, Mike and me. The first question posed was, “How much of a batter's power is related to his Fly Ball/Ground Ball ratio?” Knowing that most home runs are the result of fly balls (a few are line drive), it seemed to make sense that if a player hit more fly balls he'd be rewarded with more home runs. For a quick answer to that question I put together a scatter plot of each player's Home Runs per Balls Hit into Play (HR/BIP) and his FB/GB ratio using 2002-2005 data.
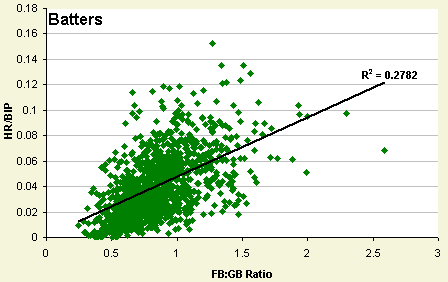
As you can see, the trend would indicate there is some correlation between how often a player hits fly balls and his home run production, but unfortunately it's not all that strong a correlation. One thing to note is that players who hit an extremely high number of ground balls don't hit a lot of home runs, but once you exit the extreme groundball category the less conclusions you can make about a batters power based on his FB/GB ratio.
What about pitchers? Does their FB/GB ratio dictate how many home runs they give up? Here's the same scatter plot for pitchers.
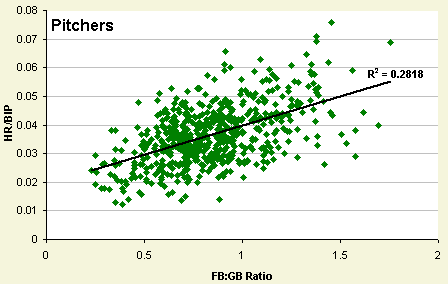
There is definitely a different shape here, but essentially it shows a similar correlation (but slightly stronger) to what the batter's graph showed. Either way, I think it's safe to say that just because a batter hits or a pitcher allows a lot of fly balls doesn't mean they'll be exiting the park. However, it does seem like the more fly balls a player hits/allows, the more susceptible to home runs he becomes.
Tomorrow (or later today), I'll be writing about how much control a pitcher has over his home runs allowed.
David Appelman is the creator of FanGraphs.