Research – Pitchers, Home Runs, & Fly Balls
Stemming from the Home Runs & Fly Balls research, there is some question about how much control a pitcher has over the amount of home runs he allows. In an attempt to answer this question, I made a scatter plot of a pitchers Home Runs per Fly Ball (HR/FB) and the change in his HR/FB the following year using data from 2002-2005.
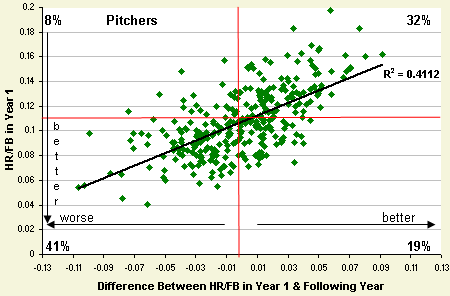
The horizontal red line is the average HR/FB, and the vertical red line indicates the place where zero change would be from year to year. This divides the chart into four quadrants. The percentages in each corner show the percentage of data points in each quadrant. For instance, 41% of the pitchers sampled had a below average HR/FB that increased the following year. Likewise, 32% of the sampled pitchers had an above average HR/FB which decreased the next year. That means that 73% reverted their home run fortunes the following year and only 27% continued their current trend.
Careful though, just because a player reverted their HR/FB doesn't mean they're doomed or saved from home runs. Here is another scatter plot that compares the first year's HR/FB directly with the next years.
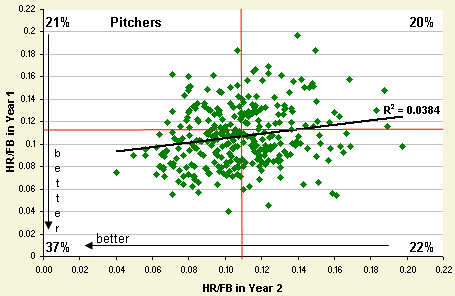
As you can see there is pretty much no correlation between a player's actual HR/FB from year to year. This tells me that while a player is likely revert their HR/FB the following year, it's unclear how much of a change there will be. One thing to note is it seems that below average players are slightly more likely to continue having a low HR/FB. However, this may just be a result of the pitchers sampled in this study.
I believe this data shows that pitchers generally do not have control over their HR/FB from year to year. This would mean that the number of home runs a pitcher allows is based on both chance and the number of fly balls a pitcher allows.
David Appelman is the creator of FanGraphs.
love the website, i am a sports scientist my self. I an wondering what graphing tools you used.