
Reviewing OOPSY’s Debut Season
The projection system OOPSY made its major league debut this year. So how did it do?
OOPSY’s methodology mirrors that of the other FanGraphs projection systems, with a few twists — most notably, the inclusion of bat speed for hitters and Stuff+ for pitchers. Projection systems are comprised of many different components, however, including aging curves, major league equivalencies to account for minor league and foreign league performance, recency weights, regression to the mean, league run environment, and park factors. There are many ways for projection systems to stand out or lag behind their peers beyond just the inclusion of a particular variable like bat speed. Projection systems are comprised of hundreds of small methodological decisions. Given the sum total of the decisions that went into OOPSY, did it hold its own in 2025 relative to its more established peers?
To review the projections, this article follows industry best practices as outlined by Tom Tango, MLBAM’s senior data architect. I have conducted this review process for pitchers before, as my pitching projections have been featured by Eno Sarris in The Athletic since 2023, but this was my first year publishing a full set of hitting projections. This review focuses on wOBA for hitters and wOBA against for pitchers (an alternative to ERA, further defined below). These metrics are typically the focus of projection system reviews, the most important hitting and pitching rate statistics for projection systems to get right from a “real-life” perspective. Both are catch-all rate statistics that measure, respectively, a player’s offensive and pitching value. The various component projections, e.g., K% and BB%, feed into these catch-all metrics.
As a guide for anyone aiming to replicate the projections review process, I’ll walk you through the steps I took, borrowing from my 2023 review.
First, I grabbed all the 2025 statistics from the FanGraphs leaderboards. I removed the hitters who pitched from the pitching data, and vice-versa (though I kept Shohei Ohtani in both data sets). I also downloaded all of the preseason projections and merged them with the 2025 statistics leaderboard. I left any missing projections blank, returning to them later on.
Next, I rescaled all of the projections so that they assumed the same league run environment. Other prominent projection reviews may sometimes skip over this, but sabermetricians view it as a non-negotiable step. If you fail to do this, the performance of your projections may be dominated by the assumptions you make about the league run environment, which are impacted by decisions that fall outside the typical scope of a projection system, e.g., decisions about how the baseball is manufactured. If you are still curious about league run environment, e.g., you want to see which projections best accounted for the effects of a new rule change, it’s best to reserve it for a separate exercise.
For demonstration purposes, here’s how I rescaled OOPSY’s wOBA projections. I looked at all of the 2025 major league hitters with an OOPSY projection. I took the average of their wOBA projections weighted by their actual number of plate appearances in 2025; for OOPSY, this was .316. Next, I rescaled all of the projections to assume the same .313 2025 league average wOBA. To do this rescaling for OOPSY, I subtracted .316 from each wOBA projection, then added .313. To convert ERA to wOBA against, Tango’s preferred catch-all metric for pitchers, I divided each pitcher’s ERA projection by their projection system’s league average ERA, took the square root, and then multiplied by the 2025 league average wOBA, .313.
Next I had to choose a strategy for addressing the missing players. Some projection systems cover a broader population of players (e.g., ZiPS), while others focus on relatively more established players (e.g., THE BAT X). You can project all of the missing players to be league average, the MARCEL approach, or slightly worse than league average, which is typically a bit more accurate. I chose a combination of these strategies, which I detail below.
Finally, I calculated the root mean square errors (RMSE) for each statistic from each projection system. I could have also calculated the mean absolute error, but RMSE is more typical. RMSE represents the standard deviation of the residuals, a measure of the typical distance between a forecast and an actual result. I weighted the RMSE by 2025 plate appearances for bats and total batters faced for arms. Following instructions from an exchange with Tango, I also calculated the difference between each projection and a naive projection, with the naive projection assuming everyone has the same projection. To calculate the difference between a projection and a naive projection, I squared both, subtracted the smaller number from the larger number, and then took the square root.
Following these steps, the table below shows the RMSE of the preseason forecasts for the full sample of hitters and pitchers in 2025 (a lower RMSE is better). The naive forecast assumes everyone has a league average projection. The composite forecast is the average of the four standalone systems (OOPSY, THE BAT X, Steamer, and ZiPS). For missing players, I imputed a projection that was either league average, 5% worse than league average, or 10% worse than league average. I chose whichever option resulted in the lowest error for each system. Hitters without a Steamer were given a league average projection. For the other systems, hitters with missing projections were given a projection 10% worse than league average. Pitchers without a THE BAT or ATC projection were given a league average projection. For the other systems, missing pitchers were given a projection 10% worse than league average.
Table 1. Forecast accuracy for full sample.
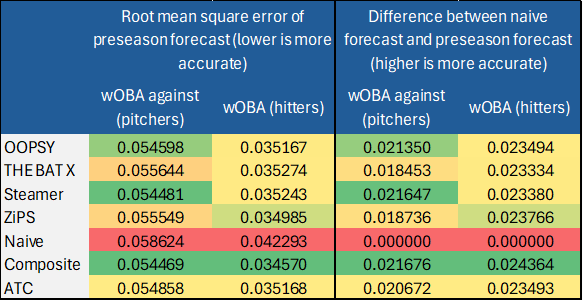
Across the full sample, Steamer was the most accurate standalone projection system for wOBA against for pitchers — as it often is. ZiPS was the clear best system for wOBA for hitters. Steamer’s pitching projections were .0216 wOBA better than the naive projection. ZiPS’ hitting projections were .0238 wOBA better than the naive projection. OOPSY held its own, ranking second of the standalone systems for both pitchers and hitters. Notably, all of the systems were grouped closely for both hitters and pitchers. The composite projection, an average of the four standalone systems, was the runaway winner overall for both arms and bats. This is no surprise, as averaging the “experts” is typically a winning approach in terms of forecast accuracy.
Next, let’s take a look at how the projections did for rookies. Note that for rookies, the naive forecast gives everyone a projection 5% worse than league average.
Table 2. Forecast accuracy for rookies.
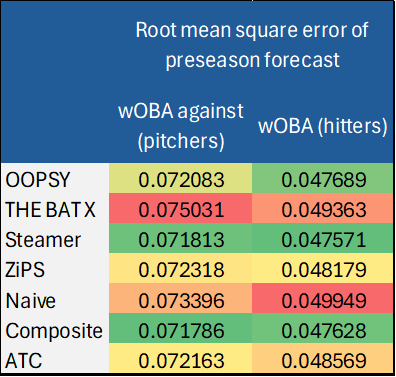
Of the standalone systems, Steamer led the way for projecting rookies in 2025, followed by OOPSY. (OOPSY’s most recent top prospects list, based on long-term projections, can be found here.) Steamer doesn’t publish long-term projections, but I’d love to see them if they ever decide to. Once again, the composite projection is the clear runaway winner overall.
Next, we’ll exclude rookies and just look at veterans.
Table 3. Forecast accuracy for veterans.
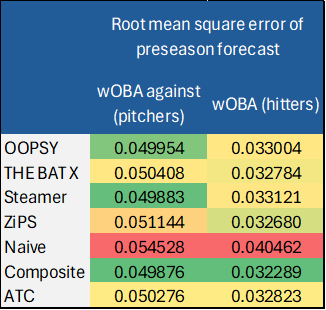
For pitchers, the results are similar to the full sample. For hitters, ZiPS still finishes first of the standalone systems, but THE BAT X jumps to second place. ATC also improves when focusing only on veterans. THE BAT X was much more accurate for veterans than for rookies, perhaps a sign that it is making good use of Statcast data that is more readily available for major leaguers than it is for minor leaguers. THE BAT X was also best-in-class last year for hitters overall. In my early explorations, it appears that THE BAT X may include variables like sweet spot and sprint speed that OOPSY does not yet include.
Finally, as a robustness check, the table below looks at OOPSY versus each system, but excludes missing players — the RMSEs below only focus on players who had a projection from both systems in each comparison. The results are similar to Table 1.
Table 4. Forecast accuracy for full sample, alternative approach.
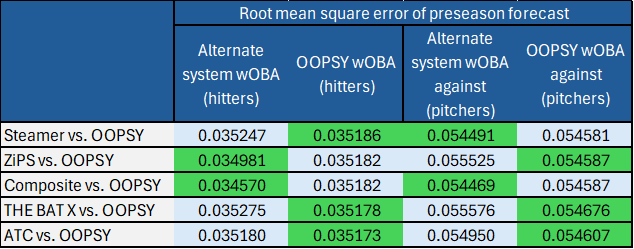
Overall, I would have liked to have the best forecasts in terms of accuracy, but it wasn’t a disappointing debut season for OOPSY. I am glad to fit in with the other FanGraphs projection systems. I have had the privilege of talking with each of these forecasters a bit over the years, and I have already learned a great deal from them. I continue to rely on their systems heavily. There is always more to be learned in the pursuit of slight improvements to forecast accuracy. I still need to look into the accuracy of my component forecasts to see where the biggest improvements can be made. I already plan to consider additional Statcast metrics to help project hitters, potentially sweet spot, sprint speed, attack angle, and horizontal spray tendency. For pitchers, there is less low hanging fruit, as my projections there have a longer history, but I may tinker with the recency weights and incorporate pitch-level metrics into the projections. I am not the only one making tweaks each offseason, however. Irrespective of the improvements that any one of us makes, users of projection systems are very likely to be best served by simply averaging the forecasts from the different systems.
Has Ariel ever disclosed which projection systems are aggregated in ATC?
Would FG consider including the Composite as a sortable leaderboard within the Projections tab?
Not to my knowledge, but I think he draws from a much larger pool than just the projections available at FanGraphs. I do think including a composite projection is something we could consider, I’ll pass along to my colleagues!
Cool! Would you switch to having depth charts and playoff odds use the composite method instead of just ZiPS and Steamer? I’ve always wondered why the playoff odds and game odds use only those two projections.
Seconded on the composite.
My takeaway is that the RMSEs are all very close together so for the purposes of fantasy baseball, it doesn’t make a huge difference which one you use. But it’s probably best to just average them all together.
I would agree. I use them all for fantasy too, I’ve played around with weighting different systems more heavily over the years, particularly pre-OOPSY. It hasn’t made much difference to my success. Projection systems are more alike than not!
Thanks for publishing this, Jordan. And congrats on OOPSY performing so well. One idea for possibly improving pitcher projections (maybe it’s already being done?) – if a pitcher’s pitch mix changes significantly (especially if they add a new pitch), then that triggers a heavier weighting to more recent data. Might be something there.
Thanks! I like the logic here, could def help with guys who have made major changes. OOPSY already places a heavy weight on recency in terms of velo and Stuff+, fwiw
I love that ZiPS puts together 3 year projects. When will OOPSY 2026 be ready!.
Reviewing the 2025 projections was the first step for getting 2026 ready…I’m not sure how long it’ll take me as it depends how much tinkering I do. I’ll get to work!
The people yearn for OOPSY(ROS) including all minors players.
we’ll have that next year…I think they showed up for all minor league pitchers this year but not for all minor league hitters, and we ran out of time in figuring it out. for now, you can find the final version of OOPSY 2025 ROS here for arms (including projections for all minor leaguers): https://drive.google.com/file/d/1uqzD_JvqWBQY7b17hnDcId4NQRx_xbTv/view?usp=sharing and here for bats (including all minor leaguers): https://drive.google.com/file/d/1n46NuruFLNu3kLkXpjD9NmoalKT0vxHA/view?usp=sharing
Did Dan make improvements to ZiPS for 2025? ZiPS has been lagging behind the other systems the past few years. The hitter performance especially came out of nowhere
I asked him this also! His biggest change was that he started incorporating spring training statistics. We also agreed that past projections reviews have probably tended to underrate zips because they often skip the step of rescaling all the projection systems to assume the same league average.
Why is wOBA rescaled by just subtracting and adding back the projection and league averages? It feels more intuitive to me that it would be divided and multiplied instead (ie if the league average is 5% higher, every projected wOBA would be 5% higher).
That is less typical but you can do it that way also, I also asked Tango this haha. It doesn’t significantly change the results. I discussed this a bit in my 2023 review (linked in paragraph 4)
My initial take on OOPSY was it’s overcalibrated towards “swing as hard as possible and make contact as hard possible” types like Stanton and not towards bat control types like Bregman or Jeff McNeil
As long as you keep that in mind, it’s pretty useful! I actually think it’s good to have a metric that demonstrates that rather than a 6th projection system that is extremely similar to the all the others but we think is .0002% better because of some slightly different weighting
Are you actually going to list the players so we can see who did the best (and the worst) using these systems?
I listed oopsy’s biggest hits and misses here:
https://x.com/RosenJordanBlum/status/1975931291133464691?t=OE87bBLdWqSaXCd8NhO4kA&s=19
Do you think these lists provide some context on potential bias inherent to the projection, or SSS and more data needed to determine that?
I think they’re interesting lists for generating hypotheses about potential biases (e.g., oopsy struggled with pitchers who changed roles, seemed to do well with elite sluggers)…but more rigorous analysis is needed