Seth Lugo’s Three-Headed Monster
As a FanGraphs reader, Mets fan, baseball follower, or some combination of the three, you’re probably familiar with Seth Lugo. We at FanGraphs haven’t written a ton about Lugo in 2019, but he is one of baseball’s most fascinating pitchers, known for his high-spin curveball that consistently finds itself atop the Baseball Savant daily spin rate leaderboards, like this one from September 15:
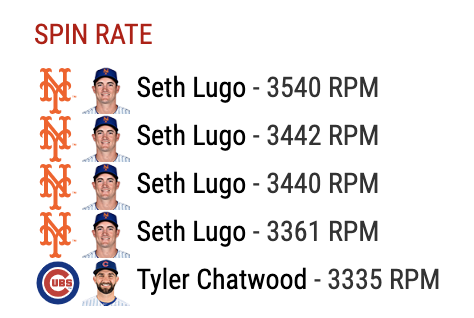
Lugo’s curveball is cool, and its coolness has generated much discussion. For good measure, here’s another look:
Wil Myers had no chance.
Clearly, Lugo’s curveball is his most interesting pitch, but that doesn’t necessarily mean it’s his best. By 2019 pitch values, Lugo’s fastball has produced the most value this season, on both a cumulative (+19.7 runs) and a rate basis (+2.84 runs per 100 pitches). And this season doesn’t represent an anomaly, either. Lugo’s fastball has produced the most runs above-average of his pitches during every season of his career, and it has only improved over time. For all the talk of Seth Lugo’s curveball, his fastball might be the pitch we need to dissect.
In 77 innings this season — his first as a true full-time reliever — Lugo has pitched to a 2.81 ERA. He’s striking out 33% of hitters, an eight-point bump from 2018. His walk rate has fallen by 1.5 points, to just 5.3%. Lugo’s 2.1 WAR this season ranks fourth among all relievers. He’s been a weapon in a Mets’ bullpen that has struggled immensely. As MLB.com’s Anthony DiComo eloquently put it in June, he’s been the Mets’ “linchpin.”
This brings us back to the fastball. Lugo’s fastball has been so effective for a few reasons, but before we do a deeper dive, it’s important to note that Lugo actually throws two fastballs — a four-seamer and a sinker. While both pitches are thrown with similar velocity, they move differently. For the purposes of this article and since they are both in the fastball family (and therefore contribute to Lugo’s overall fastball pitch value total), I’m going to discuss both.
Lugo consecutively threw his sinker and four-seamer to Jason Heyward on August 29, getting called strikes on both.
Here’s the 0-1 sinker:
Now, the 0-2 four-seamer:
Against Lugo’s four-seamer, hitters whiff 31% of the time; against the sinker, they whiff 21% of the time. Both of these figures are elite — his fastball whiff% ranks in the 93rd percentile, while his sinker whiff% ranks in the 90th. The weird thing about both of these pitches, though, is that neither offers intrinsic characteristics to explain their success. Lugo’s four-seam fastball velocity is well above-average, yes, but fastball velocity alone does not explain his whiffs. In fact, there’s only a weak correlation (r=0.32) between fastball velocity and whiff rate overall.
There must be something more going on here, and movement might explain part of it. Lugo’s fastball generates about 8% more vertical break than the typical fastball at that velocity. Looking back at that Heyward at-bat, we can see that the pitch does drop quite a bit; per PITCHF/x data, Lugo’s fastball is dropping, on average, 8.5 inches this season (gravity excluded). His sinker, likewise, also has notable movement tendencies. This time, however, it’s the movement that the pitch doesn’t have that makes it interesting. Lugo’s sinker drops 13% less than the average sinker at that velocity, while moving horizontally about 5% more. Lugo’s sinker is both unique from his four-seam fastball and does not behave like the archetypal sinker, likely making it harder for hitters to pick up and — ultimately — hit.
What I’m most fascinated by, however, is how Lugo puts it all together. He is excellent at playing his pitches off of one another. He appears to be an excellent pitch tunneler. Let’s consider this four-pitch plate appearance versus Phillies outfielder Adam Haseley from August 31.
Pitch 1: 92.6 mph four-seam fastball, called strike
Pitch 2: 93.9 mph sinker, foul
Pitch 3: 80.6 mph curveball, ball
Pitch 4: 81.5 mph curveball, swinging strikeout
Lugo made quick work of Haseley, getting the strikeout with the deadly curve. It wasn’t just the last pitch that set up this outcome, however. It was more of a result of how the four pitches interacted with one another. Here’s a chart plotting each pitch of the at-bat, as well as the location of each pitch at Haseley’s decision-making point:
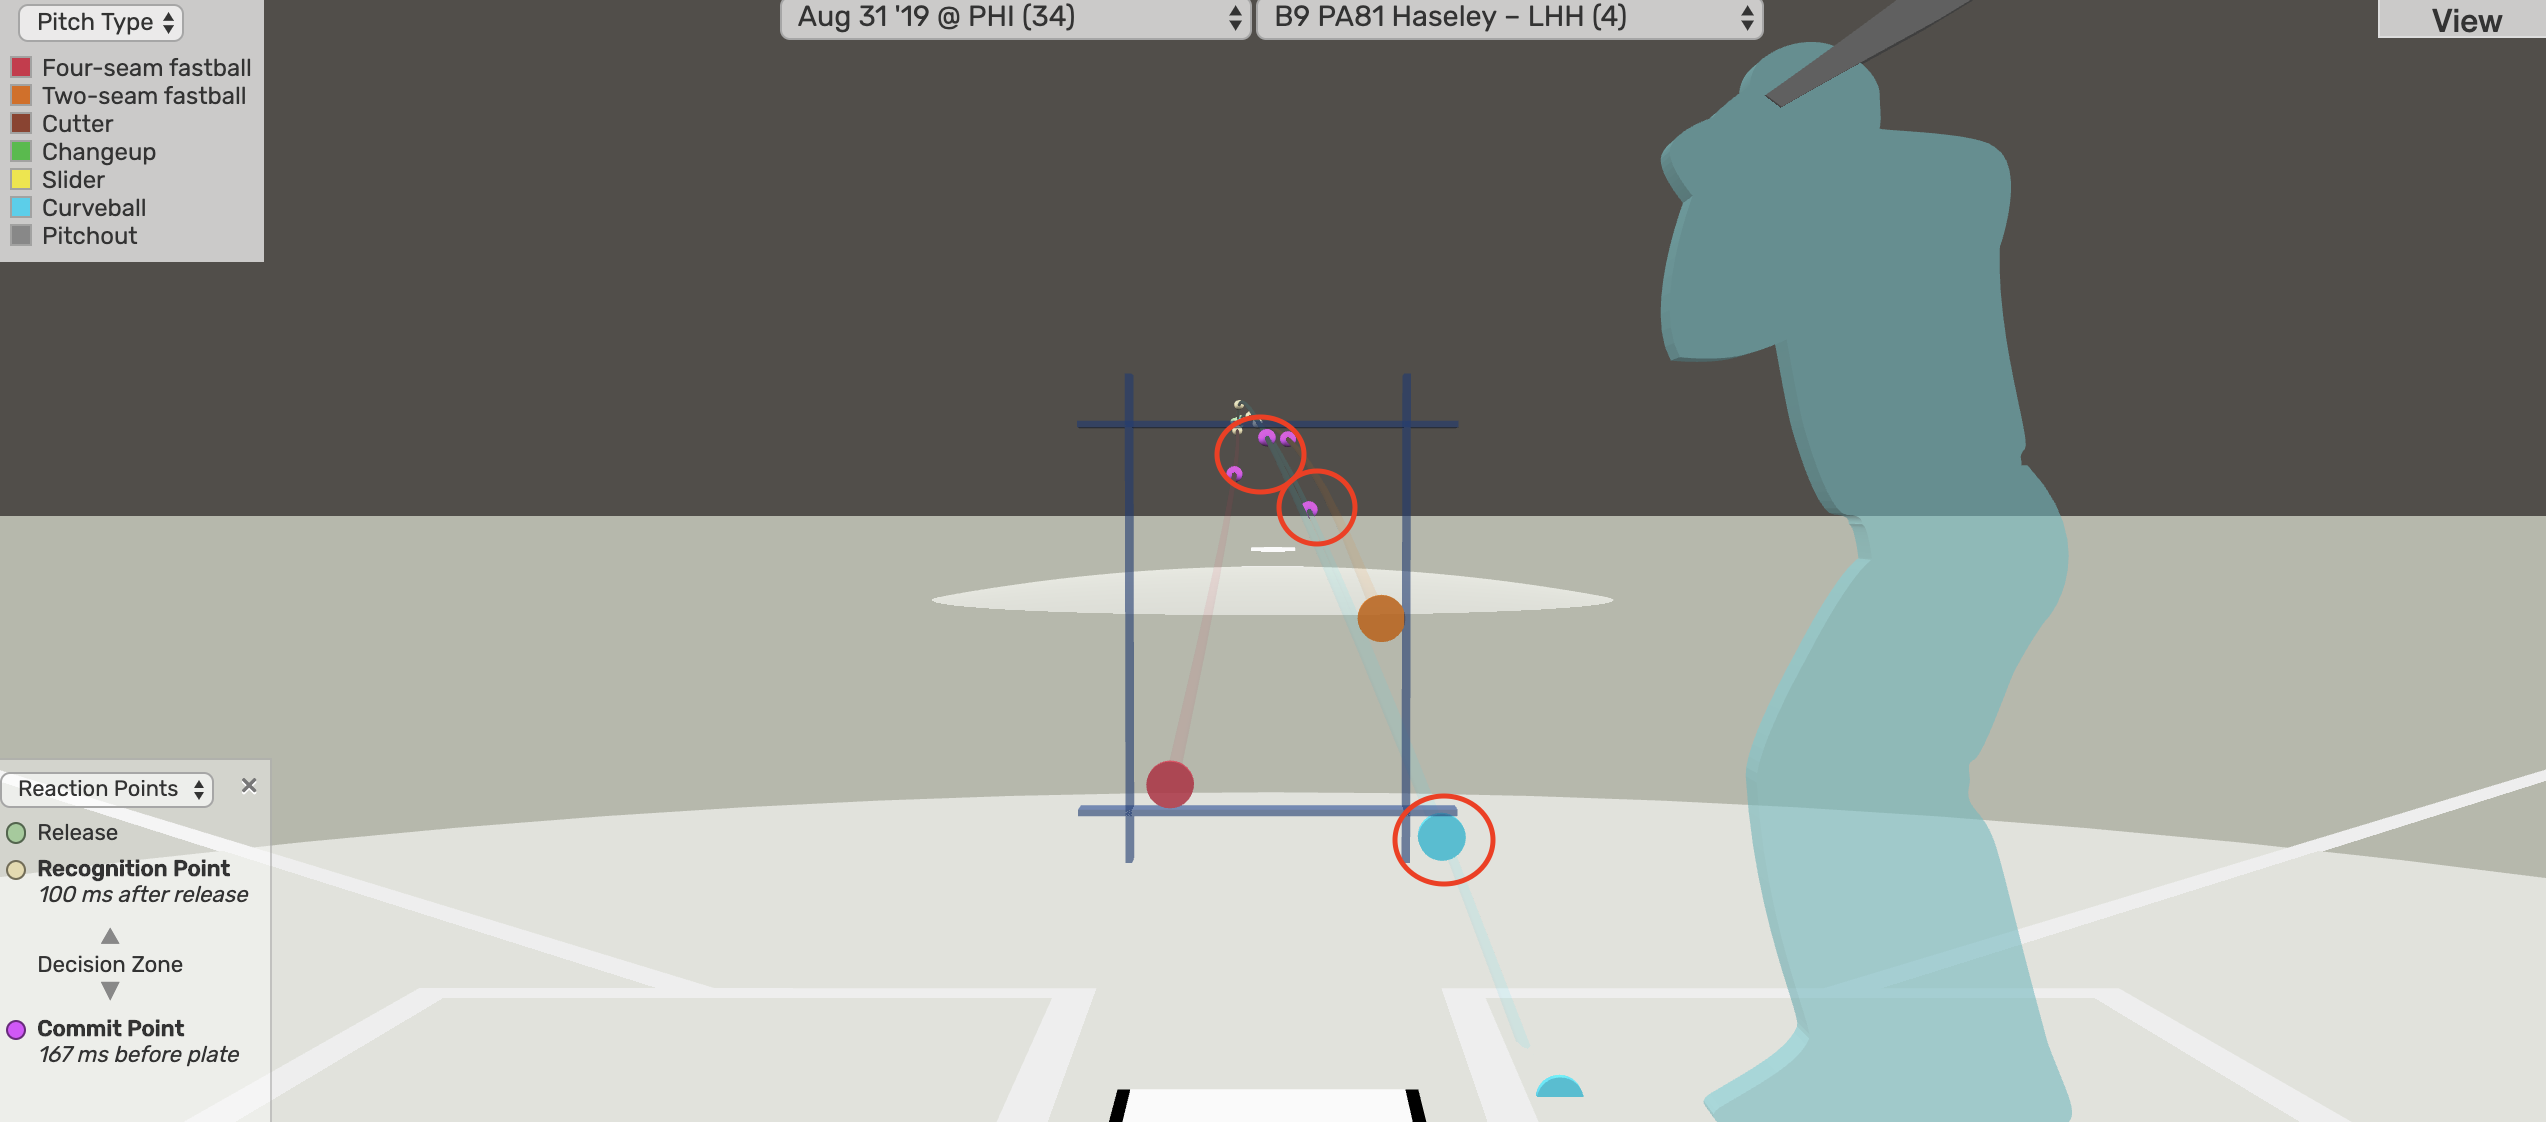
There’s a lot going on here, so let’s break it down quickly. The pink dots mark the location of each pitch of the at-bat at Haseley’s decision-making point. I’ve circled them in red. The red circle to the left represents pitches that resulted in strikes, whether that be the first pitch called strike, the foul ball, or the swinging strikeout. The red circle on the right represents the commit point for Haseley on the second pitch he took, the ball. And the red circle at the bottom of the screen represents the resulting location of the strikeout pitch.
Clearly, Lugo is tunneling well. He throws three different pitches in this at-bat, and all of them, with the exception of the curveball that bounced, are located relatively close together at the hitter’s commit point. For Lugo and the Mets, that’s exactly what you’d want to see.
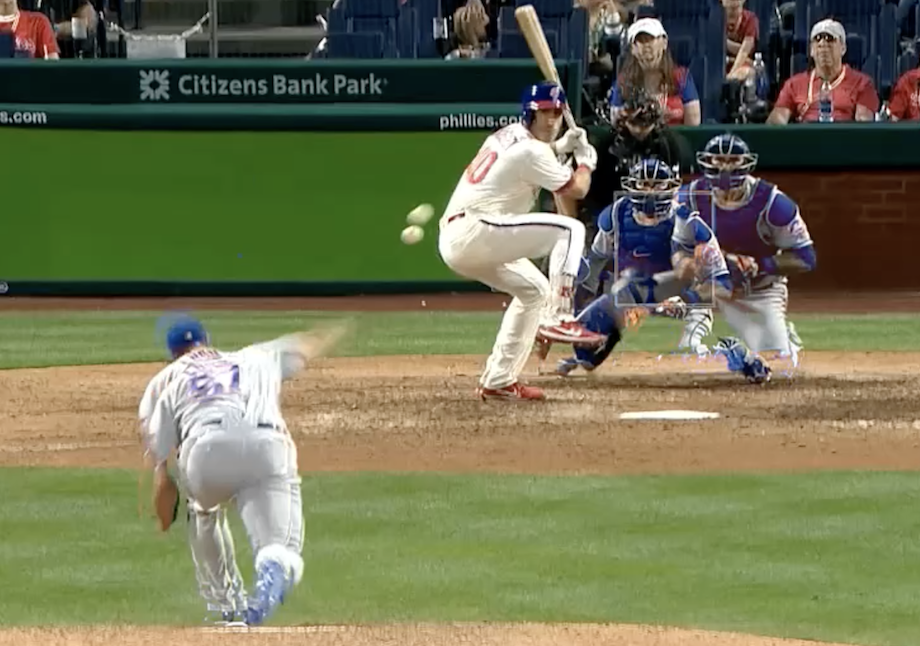
It might be hard to tell from this image what that looks like in actuality, which is why I asked Rob Friedman, the owner @PitchingNinja, to make an overlay in order to better visualize what Lugo is doing here. Here’s the GIF of the fouled-off fastball and the curveball strikeout, courtesy of Friedman:
That’s some cool stuff. I can only imagine how hard it must be to hit Lugo, knowing that he not only has a hammer of a curve, but also tunnels well enough that the drop does not come into play until after the decision-making point. This is what all pitchers strive to do, but Lugo does it quite well. Here’s a screenshot from the above GIF, showing just a hint of separation between the two pitches:
This is why Seth Lugo has been so successful. In a vacuum, Lugo’s fastball and sinker might be good pitches, but when paired with his curveball, they play up so much more. This may explain why Lugo has actually decreased his year-over-year curveball usage from 32% to 24%. Since he’s now able to rely on other pitches, he’s less predictable. We’re seeing the benefits of that in his curveball results too — his xwOBA allowed on the pitch has dropped by 35 points, from .233 to .198.
Seth Lugo’s curveball has traditionally been his most interesting pitch, but it’s not the one that has generated the majority of his success. Lugo has paired his curve well with his fastball and sinker to create a triad of unhittable weapons.
Devan Fink is a Contributor at FanGraphs. You can follow him on Twitter @DevanFink.
Seth Lugo’s season has been the worst part of the Edwin Diaz trade. The Mets invested what is now a top 20 prospect for a guy expected to be the best closer in franchise history. As it turns out, that guy was in the bullpen all along.
Sorry to disagree with you but the worst part of the Edwin Diaz trade has been Edwin Diaz. I would like to argue the case that Edwin Diaz’s season has been the worst ever by a closer. The numbers speak for themselves and the home runs are beyond the pale. What’s worse is that he was allowed to continue in the role when it was obvious to even the ghost of Ray Charles that Lugo was a much better option. The trade will continue to haunt the Mets for years to come but he was the most important factor in the Mets not making the post-season this year.
“I would like to argue the case that Edwin Diaz’s season has been the worst ever by a closer.”
**cough** Junichi Tazawa, 2015 and Mychal Givens this year **cough**
(just looking at the last 5 years…)
These two guys were not considered front line closers at any time in their careers. There is no comparison here whatsoever.
“worst closer season of all time” and “worst closer season when compared to expectations” are different things. Maybe Diaz will continue his every other year is great streak and be the best again next year. Or…always be trading closers.
I will stand by statement that Diaz’s season is the worst season ever by a closer. Nobody has ever had as many closing opportunities and allowed more HR’s or finished with a higher ERA.
Edwin Diaz, 2019: 65 G, 57 IP, 47 games finished, 25/32 SV (78.1%), 5.68 ERA/4.61 FIP/3.11 xFIP, 1.404 WHIP, -0.1 fWAR, -0.6 bWAR
Brad Lidge, 2009. 67 G, 58.2 IP, 55 games finished, 31/42 SV (73.8%), 7.21 ERA/5.45 FIP/4.69 xFIP, 1.807 WHIP, -0.8 fWAR, -2.6 bWAR
A very brief check shows Mychal Givens with a positive 0.5 bWAR and Edwin Diaz with a negative -0.5 bWAR this year. Tazawa wasn’t even the closer for the Red Sox in 2015, Uehara was. I don’t mind debate but at least produce some accurate statistics.
The Rob Friedman overlay is just sick
What’s also worth noting is how consistently he is used now compared to at the beginning of the year. At the beginning, they would almost always give him around 3 days rest between outings. As the season has progressed, he has much more frequently been used with less rest. I think that his numbers might improve next year as he gradually becomes more and more accustomed to being a reliever.
(Unless the Mets want to be cheap and put Lugo back in the rotation and hope they can scrounge up some nice bullpen pieces. Fingers crossed they don’t mess this up.)
The worst part of the trade is that the trade happened. Who trades for a closer when you’re not in contention? Who trades for a washed up, caught using steroids, and VERY EXPENSIVE 2b when we had a potential batting champion in Mcneil already? McNeil put up positive defensive metrics at multiple positions! I’ll give Brody love for getting JD Davis, but WOW, the trade for Diaz and Cano made no sense on so many levels. I am very curious how Brody saw it all playing out cause I just never saw it from day one.