
Shutdowns, Meltdowns and Making the Playoffs
Earlier this season, I brought up my dislike for the Saves statistic. Then, Tom Tango got the ball rolling (here and here) on creating a better way of measuring relief appearance success and, within a couple of days, the statistics Meltdowns and Shutdowns were available here at Fangraphs.
Shutdowns were supposed to mirror the total number of holds and saves in a season. As of yesterday, a total of 3403 number of shutdowns have occurred so far this season compared to a total of 3142 saves and holds. With only about 8% more shutdowns being recorded compared to saves and holds, the logic behind the values seem to be holding up fairly decent.
To see how teams stack up comparably, here is a look at the leaders and laggards in shutdowns across the league:
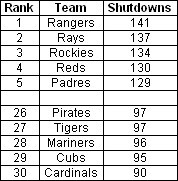
It seems the cream rises to the top as the top five teams have made the playoffs or are still in contention, while the bottom five teams are not going to make the postseason.
Along with shutdowns, meltdowns were created to measure the relief appearances that significantly hurt a team’s chances of winning. In comparision, here are leaders and laggards in the number of meltdowns:
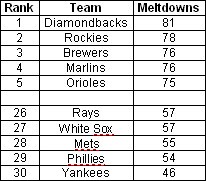
All the teams with the most meltdowns won’t make the playoffs, except maybe Colorado. Three of the five teams with the least number of meltdowns will make the playoffs with the Mets and While Sox being the exceptions.
Finally, the best way to see how the pen has done as a whole is to get the ratio of the number of shutdowns compared to the number of meltdowns. So far this season the league average is 1.73 shutdowns for every meltdown. Again here is a list of the top and bottom teams in the league:

No real surprise here with five playoff or likely playoff teams making the top list and five non-playoff teams at the bottom. Besides the top-five teams, here are how the rest of the possible playoff teams rank:
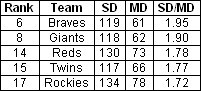
Having a capable bullpen that keeps its team in games (compiling shutdowns) and doesn’t blowup (meltdowns) isn’t all that a team needs in order to make the playoffs, but all the teams making the playoffs have addressed it nicely during this season.
Jeff, one of the authors of the fantasy baseball guide,The Process, writes for RotoGraphs, The Hardball Times, Rotowire, Baseball America, and BaseballHQ. He has been nominated for two SABR Analytics Research Award for Contemporary Analysis and won it in 2013 in tandem with Bill Petti. He has won four FSWA Awards including on for his Mining the News series. He's won Tout Wars three times, LABR twice, and got his first NFBC Main Event win in 2021. Follow him on Twitter @jeffwzimmerman.
One factor in this, which in some cases may have nothing to do with the quality of the bullpen, is whether or not the bullpen inherits many high-leverage situations. I am a Mariners fan, and if you look at the shutdown/meltdown statistics, there are only two pitchers (Aardsma and League) who have much of either. But I think that’s because the Mariners are so often out of the game by the time the bullpen comes in. Good teams, by virtue of their offense and starting pitching, will keep more games close, and thus hand on higher leverage situations to their bullpens, and will thus accumulate more, not because of the bullpen’s quality, but just because of having more opportunities.
For the reasons you stated, is the reason I like the ratio used. With the Mariners, they had shutdowns = 96,meltdowns = 63 and a ratio of 1.52. They are just below league average, but number of meltdowns is what brings there ratio down.
Yes, I see. I like the concept. Good work!
I really like the concept of looking at the SD/MD ratio. Any way that could be added to the leaderboards?
Like b_rider I am unsure about using these stats to rate a bullpen, even the ratio. For instance being a Cardinals fan I assume the number of shutdowns is lowest mainly because of our starting pitching handing out relatively few high leverage innings, either because we are so far behind or so far ahead. The ratio would correct this somewhat but ends up giving equal weight to the “top” and “bottom” of the bullpen. LaRussa especially uses very different sets of releivers depending on whether the Cardinals have a lead or are behind. Franklin hardly ever pitches when the game is tied or the Cards are behind yet will always pitch a save situation which would normally be a decently high leverage situation. Using these stats to analyze a specific releiver is fine though, it seems to work great for that.
“Franklin hardly ever pitches when the game is tied or the Cards are behind yet will always pitch a save situation which would normally be a decently high leverage situation.”
I don’t think that’s very different from 95% of manager’s treatment of their bullpens in general, or their closers specifically. LaRussa sure likes to play the L/R splits, but his closer usage isn’t atypical.
“I assume the number of shutdowns is lowest mainly because of our starting pitching handing out relatively few high leverage innings, either because we are so far behind or so far ahead.”
I tend to think the opposite about the Cards – good pitching, mediocre-at-best hitting, so that would tend to depress run scoring in both cases and lead to more close, low-scoring affairs and consequently more high leverage innings rather than fewer. The YTD stats tend to back that up; the Cards’ pitching staff is 5th in MLB in ERA, 8th in FIP, while the hitters are right square in the middle (15th) in both wOBA and wRC. The Cards strike me as one of the teams playing a lot of 4-2 games, and not so many 12-3 or 16-10 games.
Except when Suppan pitches. Then it might be 12-3.
(After four innings.)
To me the first part of this is a rather ho-hum observation. “Teams that win a majority of their games will have better shutdown statistics than teams that don’t.” I’m supposed to be impressed by this finding?
I’d wager that the 2009 Phillies would have made an example of a winning team that had a huge number of meltdowns relative to their peers (i.e. teams that made the playoffs). So while it isn’t the most impressive statement, it is logical.
I thought I would point out somewhere that no team in the AL West or Central has a winning record against the AL East. Oddly the closest is the Royals with a 15-16 record.
That sets me up to ask the question when we talk about these teamwide statistical evaluations in understanding successful roster construction don’t we need another way to evaluate team performance rather than “mak[ing] the playoffs”? If 4 of the 7 or 8 best teams in baseball are in the AL East does that mean that we should negatively evaluate the Blue Jays and Red Sox’s rosters based on their bullpens?
[…] let’s look at team relief stats. On Monday Jeff went over shutdowns and meltdowns and how they affect playoff teams. Here we’ll look at some similar data, plus some other […]
[…] Shutdowns, Meltdowns and Making the Playoffs (FanGraphs). Yeah, that Padres bullpen would be devastating in a short series. [h/t reader Didi] […]