The Best & Worst of Pitcher Strike Zones, With Dallas Keuchel
A couple weeks ago, I examined, on the team level, who has and hasn’t been drawing a benefit from the called strike zone. That post is here, and it talks about the zone while pitching, and about the zone while hitting. Earlier this very week, I looked at some individual hitter strike zones through the season’s first half, and that post is here. It makes sense to look at individual pitchers. If we have the team data, and if we have some individual hitter data, why not close the loop? I don’t want to leave you wanting more. I want to leave you never wanting to hear about this stuff again, or at least not for a while.
When a hitter’s had a particularly big or small strike zone, that seems to be luck, for the most part. Some of it’s the competition, but there doesn’t seem to be much of a signal. With pitchers, there’s more of a signal, because they’re the ones in control. And they’re also linked to their catchers, who might be good or bad pitch-framers. If a hitter’s been, say, lucky with strikes, that hardly means anything going forward. But if a pitcher’s racked up extra strikes, that bodes well for what’s to come. That’s something to keep in mind when you read all the rest.
We’ll be looking at pitchers with more or fewer strikes than expected. As you peruse the tables, you’ll be seeing evidence of skill, but skill that leaves many frustrated. Pitchers with good command tend to get more favorable zones than pitchers with bad command. And pitchers with good receivers will get more favorable zones than pitchers with bad receivers. Command is a developed skill, and receiving is a developed skill, but to a lot of people, the strike zone is the strike zone, and it shouldn’t shift around. To a lot of people, it should be called the same for everybody. It’s not! Maybe one day. For now, we’re still in our day.
This paragraph goes in every one of these posts. With information readily available on FanGraphs, it’s possible to calculate a number of expected strikes. We also display the number of actual strikes, and then from there it’s easy. The difference between those numbers tells you something about the pitcher strike zone. A pitcher with more actual strikes than expected strikes has had a more favorable zone. A pitcher with fewer actual strikes than expected strikes has had a less favorable zone. This isn’t the most rigorous method in the world, but in the past it’s matched up well with more detailed investigations. Here’s the acknowledgment that PITCHf/x isn’t perfect, so there are some error bars here. I don’t know how big they are! For the tables below, I set a minimum of 1,000 pitches thrown.
So: the most favorable pitcher zones?
| Rank | Name | Extra Strikes |
|---|---|---|
| 1 | Dallas Keuchel | 76 |
| 2 | Jon Lester | 68 |
| 3 | Mike Leake | 46 |
| 4 | Roberto Hernandez | 40 |
| 5 | Gio Gonzalez | 37 |
| 6 | Francisco Liriano | 36 |
| 7 | J.A. Happ | 32 |
| 8 | CC Sabathia | 32 |
| 9 | Ubaldo Jimenez | 30 |
| 10 | Wade Miley | 30 |
Note that this is shown as a counting stat, not as a rate. And by the counting stat, Dallas Keuchel is your midseason leader, followed by Jon Lester, followed by no one real close. Keuchel has recorded 76 more strikes than expected, based on his zone rate and out-of-zone swing rate. Lester trails Keuchel by eight, and then Leake trails Lester by 22. Fifth place has fewer than half as many extra strikes as first place. This is pretty remarkable.
It’s also not hard to see why Keuchel gets the benefit of the doubt. Let’s look at an example heat map from Baseball Savant. Keuchel’s pitch locations against righties:
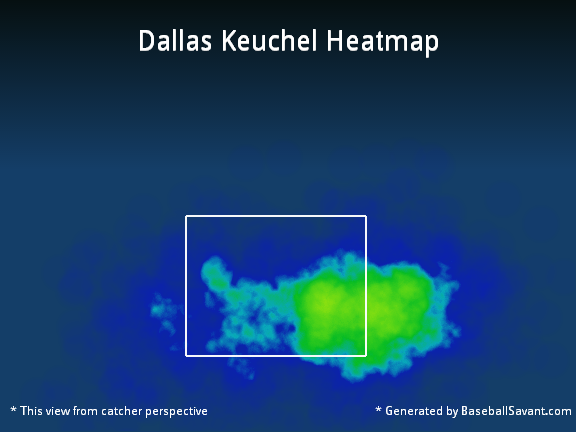
Keuchel practically lives in one spot, rarely straying from the down-away quadrant. He hangs around the borders, and this is around an area where umpires have become more generous over time. Keuchel’s catchers prepare for him to throw in this spot, and Keuchel has sufficiently good command he doesn’t often miss across the plate. And Keuchel works with some pretty good receivers, so when you think about it, everything is working in Keuchel’s favor, in this regard. He’s got the command, he’s got the catchers, he’s got the pitches, and he’s got the pitch tendencies. Keuchel has proven to be pretty good about limiting quality contact. Considering where he throws, and where he gets calls, it’s not a shock.
I also don’t think it’s a shock to see Lester right behind Keuchel. Lester has worked almost exclusively with David Ross. Last year, the Lester/Ross pairing was perhaps baseball’s most successful in terms of expanding the strike zone off the edges. Ross can’t have that much time left, but for now, he just gets Lester, and they’re so on the same page they’re at the same sentence. No, that’s stupid, let’s just keep going.
The least favorable pitcher zones?
| Rank | Name | Extra Strikes |
|---|---|---|
| 1 | Shelby Miller | -52 |
| 2 | Collin McHugh | -39 |
| 3 | Anibal Sanchez | -35 |
| 4 | Edinson Volquez | -31 |
| 5 | Jordan Zimmermann | -27 |
| 6 | Michael Lorenzen | -26 |
| 7 | Jesse Hahn | -25 |
| 8 | Max Scherzer | -22 |
| 9 | Chris Tillman | -21 |
| 10 | David Price | -21 |
In the first table, Keuchel and Lester were running away with it. Here, Miller is kind of running away with it, and with that in mind, let’s look at a little comparison. A .gif of Dallas Keuchel’s called strikes and Shelby Miller’s called strikes:
Maybe that’s helpful. Maybe you can’t really learn that way, and there are a lot of numbers and colors present, but the short of it is, for all the things working in Keuchel’s favor, Miller hasn’t really had them. He hasn’t had the good defensive catchers, he doesn’t have Keuchel’s command, and Miller elevates his pitches more, where there are fewer called strikes to be found. Pretty obviously, it hasn’t hurt Miller’s ERA. At the same time, I’m sure he wouldn’t complain about getting a little bit more help.
You can see this isn’t just about command. David Price is in the table. Max Scherzer is in the table. Jordan Zimmermann is in the table. There’s mediocre framing there, and some luck. It’s also interesting to see Collin McHugh, who’s among Keuchel’s teammates. Here’s McHugh, toward the opposite extreme. This is a good reminder that receiving, like defense, doesn’t affect everyone equally. Though McHugh is also on the Astros, he has a different style from Keuchel, so he can’t get the same zone benefit. McHugh also doesn’t have the command that Keuchel does. Principles you want to apply across the board don’t always apply across the board.
Real quick, I thought it’d be interesting to look at how some players have changed, from 2014. Who’s getting a more favorable strike zone? Who isn’t? Here are the top five pitchers getting more of a benefit:
- J.A. Happ
- Roberto Hernandez
- Kyle Hendricks
- A.J. Burnett
- Dallas Keuchel
You could link them all to the catchers. Happ is now being caught by Mike Zunino. Hernandez and Keuchel are both on the Astros. The Cubs upgraded their catcher defense, and Burnett is being caught by Francisco Cervelli. Lester, by the way, is in sixth. And the five pitchers getting less of a benefit:
- Andrew Cashner
- Shelby Miller
- Edinson Volquez
- Shane Greene
- Yovani Gallardo
And, we get to point to the catchers again. Cashner is no longer working with Rene Rivera. Miller no longer has Yadier Molina. Volquez no longer has Russell Martin. Greene no longer has Brian McCann. Gallardo no longer has Jonathan Lucroy. I’ve tried to make it clear that this isn’t all about pitch-framing, but in a lot of cases, it’s mostly about pitch-framing. It should be apparent that pitch-framing isn’t everything, that it’s possible to be bad with good framing, and good with bad framing. All it is is a part of the puzzle. But it’s a part the pitchers notice. Pitchers are always noticing things.
Jeff made Lookout Landing a thing, but he does not still write there about the Mariners. He does write here, sometimes about the Mariners, but usually not.
Of the next 10 most favorable zones, how many belong to LHP?
and only one lefty in the least favorable zones
I noticed that too, 7 of the top 10 are LHP. Very interesting.