
The Best Team Defenses of 2025 (So Far)
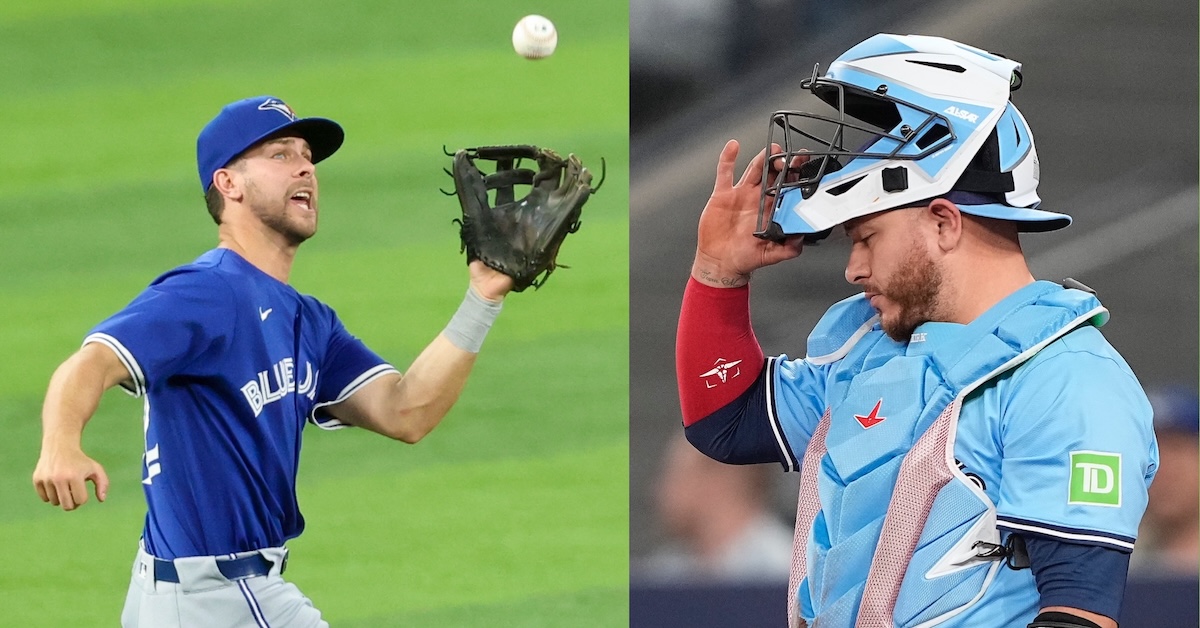
Coming into 2025, you might not have expected Alejandro Kirk and Ernie Clement to play central roles on a playoff contender. Neither player was an above-average hitter last season; in fact, each hit for a 93 wRC+ while playing regularly for a team that won just 74 games. Yet the pair rank first and second in position player WAR on the Blue Jays, thanks not only to improved offense but exceptional glovework, with Kirk battling the Giants’ Patrick Bailey for the top spot in two catching metrics, and Clement ranking among the best third basemen while also posting strong metrics in limited duty at the three other infield positions. The pair have not only helped the Blue Jays to a 47-38 record and the top AL Wild Card position, but also the top ranking in my annual midseason defensive breakdown.
Kirk and Clement aren’t Toronto’s only defensive stalwarts. Second baseman Andrés Giménez and center fielder Myles Straw, a pair of light-hitting glove whizzes acquired from the Guardians in separate trades this past winter, have been strong at their respective positions, with the latter helping to cover for the absences of Daulton Varsho. A Gold Glove winner last year, Varsho missed the first month of this season recovering from right rotator cuff surgery, and returned to the injured list on June 1 due to a strained left hamstring. Even in limited duty, Straw, Varsho, and Giménez — who missed about four weeks due to a quad strain, with Clement filling in at second for most of that time — have all rated as three to five runs above average according to Statcast’s Fielding Runs Value (FRV), and five to eight above average according to Defensive Runs Saved (DRS). Clement has totaled 12 DRS and 10 FRV at the four infield spots; in 359.2 innings at third, he’s second in the majors in both DRS (7) and FRV (5).
This is the third year in a row I’ve taken a midseason dip into the alphabet soup of defensive metrics, including Defensive Runs Saved (DRS), Statcast’s Fielding Run Value (FRV), and our own catcher framing metric (hereafter abbreviated as FRM, as it is on our stat pages). One longtime standby, Ultimate Zone Rating (UZR), has been retired, which required me to adjust my methodology.
On an individual level, even a full season of data isn’t enough to get the clearest picture of a player’s defense, and it’s not at all surprising that samples of 700 innings or less produce divergent values across the major metrics. After all, they’re based on differing methodologies that produce varying spreads in runs from top to bottom, spreads that owe something to what they don’t measure, as well as how much regression is built into their systems. Pitchers don’t have FRVs, and DRS tends to produce more extreme ratings (positive and negative) than Statcast. But within this aggregation, I think we get enough signal at this point in the season to justify checking in. I don’t proclaim this to be a bulletproof methodology so much as a good point of entry into a broad topic.
A bit more about the methodology is in order. To account for all the bits in the alphabet soup, I aggregated the aforementioned metrics, adjusting for the varying spreads in run values by using standard deviation scores (z-scores), which measure how many standard deviations each team is from the league average in each category. As with last year, I’ve broken out catcher values for both FRV and DRS from the rest of a team’s values in both metrics. Note that the version of DRS that we display on FanGraphs now includes a framing component (rSZ, for strike zone) that isn’t used in Baseball Reference’s WAR calculations (you can find it on a player’s fielding page). The three catcher measures (including FRV) are each weighted at one-half the value of the non-catcher scores, which improves the overall z-score formula’s correlation with run prevention. New for this year, I’m using Defensive Efficiency, the rate at which a team turns batted balls into outs, published at Baseball Reference. I originally weighted that equally with non-catcher DRS and FRV, but found that weighting it at 1.5 times improved the correlation with run prevention. Last year’s midseason z-score formula had a -.39 correlation with runs allowed per game (higher scores mean fewer runs allowed), but with this year’s reconfigured formula, the correlation has improved to -.75.
The spreads for the various categories:
| Metric | Split | Max | Min | StDev |
|---|---|---|---|---|
| DRS_non-C | Non-Catchers | 50 | -39 | 23.3 |
| DRS_C | Catchers | 14 | -11 | 6.2 |
| FRV_non-C | Non-Catchers | 18 | -19 | 10.6 |
| FRV_C | Catchers | 18 | -11 | 6.6 |
| FRM | Catchers | 9.3 | -11 | 4.9 |
| Def Eff | — | .724 | .661 | .016 |
Here’s how the rankings look, top to bottom; you can see the actual run values for all but the DRS and FRV catcher breakouts here. I’ve highlighted each category’s leaders and trailers, which helps to illustrate where the metrics agree and disagree:
| Team | DRS_nonC-z | DRS_C-z | FRV_nonC-z | FRV_C-z | FRM-z | DefEff-z | Tot |
|---|---|---|---|---|---|---|---|
| Blue Jays | 0.89 | 1.80 | 1.52 | 2.55 | 1.73 | 0.51 | 6.21 |
| Braves | 1.71 | 1.15 | 1.24 | 0.89 | 0.53 | 0.38 | 4.81 |
| Rangers | 1.84 | -0.63 | 0.86 | -0.61 | 0.35 | 1.65 | 4.73 |
| Yankees | 0.81 | 0.02 | -0.08 | 0.89 | 1.91 | 1.40 | 4.23 |
| Cubs | 1.45 | 0.66 | 1.33 | 0.44 | -0.55 | 0.57 | 3.92 |
| Tigers | 0.55 | 0.83 | 0.11 | 1.04 | 1.23 | 0.89 | 3.54 |
| Cardinals | 0.16 | 0.34 | 1.71 | -0.01 | 0.23 | 0.25 | 2.53 |
| Pirates | 0.55 | -0.47 | 0.67 | -0.61 | -0.45 | 1.21 | 2.26 |
| Giants | 0.25 | 1.15 | -0.18 | 1.64 | 1.83 | -0.19 | 2.10 |
| Brewers | 0.16 | 0.02 | 1.33 | 0.59 | -0.31 | 0.19 | 1.93 |
| Reds | 0.33 | -0.31 | -0.36 | -0.46 | -0.14 | 1.46 | 1.70 |
| Rays | 1.15 | 0.18 | -0.27 | -1.06 | -0.97 | 1.08 | 1.57 |
| Royals | 0.25 | -0.15 | 0.48 | -0.31 | 0.04 | 0.63 | 1.48 |
| Astros | 0.29 | -0.47 | 1.33 | -1.36 | -1.29 | 0.83 | 1.30 |
| Padres | -0.40 | 0.02 | 0.77 | -0.91 | -0.31 | 0.70 | 0.81 |
| Red Sox | -0.05 | 2.28 | 0.01 | 1.19 | 0.92 | -1.08 | 0.54 |
| Guardians | 0.07 | 1.31 | 0.67 | 1.19 | 1.05 | -1.33 | 0.52 |
| Mariners | 0.42 | -0.63 | -0.93 | 0.14 | 0.70 | 0.51 | 0.35 |
| Dodgers | 0.89 | 0.02 | 0.01 | -0.91 | -0.62 | 0.00 | 0.15 |
| Mets | 0.29 | 1.31 | -0.84 | 0.74 | 0.08 | -0.32 | 0.04 |
| Diamondbacks | -1.26 | 0.50 | -0.08 | 0.89 | 1.09 | -0.44 | -0.77 |
| Marlins | -0.36 | -0.63 | -0.08 | -0.91 | 0.25 | -0.57 | -1.94 |
| White Sox | -0.57 | -0.63 | -1.31 | -0.46 | -0.86 | -0.32 | -3.33 |
| Twins | -1.22 | -0.96 | -0.46 | -0.46 | -0.90 | -0.57 | -3.69 |
| Phillies | -1.69 | -0.63 | -0.46 | 0.14 | -0.68 | -0.76 | -3.87 |
| Orioles | -1.13 | 0.02 | -1.78 | -0.46 | -0.14 | -1.59 | -5.58 |
| Athletics | -1.17 | -1.28 | -1.59 | -0.16 | -0.41 | -1.27 | -5.59 |
| Nationals | -0.79 | -1.28 | -1.50 | -1.81 | -2.26 | -0.76 | -6.10 |
| Angels | -1.43 | -1.76 | -1.40 | -1.21 | -1.36 | -1.14 | -6.71 |
| Rockies | -1.99 | -1.76 | -0.74 | -0.61 | -0.68 | -2.35 | -7.78 |
What follows is a closer look at the top six teams by this rating. Since writing about the bottom-ranked teams amounts to shooting fish in a barrel, I’ve chosen to bypass that one. Instead, I’ll have a companion article covering the contenders with the weakest defenses sometime before the July 31 trade deadline.
Blue Jays
Toronto is the runaway leader, with more than a full point separating the team from the rest of the pack; the distance between the Blue Jays and the second-place Braves is about the same as that between the Braves and the sixth-place Tigers, or the sixth-place Tigers and the ninth-place Giants.
The tandem of Kirk and backup Tyler Heineman helps the Blue Jays dominate the catcher-based rankings; they’re among the top three in all three categories. Kirk (in 521 innings) leads the majors in FRV (14 runs), with a share of the lead in the each of the three categories it covers: framing (8), blocking (3), and throwing (3). He’s also second in FRM (6.4), and is tied with Heineman (in 209.2 innings) for fourth in DRS (6).
Along with the excellence of Straw and Varsho in center — the pair has combined for 14 DRS and 8 FRV in just 511.1 innings — and Clement anywhere manager John Schneider has played him, it’s worth noting the defense of Vladimir Guerrero Jr. After playing DH-caliber defense the past two seasons (a combined -16 FRV and -7 DRS), he’s been one run above average according to FRV (with all of his directional Outs Above Average measures moving from negative to positive) and four above average via DRS. That’s what you like to see from your franchise player. About the only sour note in the field for the Blue Jays has been sounded by shortstop Bo Bichette (-5 DRS, -2 FRV).
Braves
Not much has gone right for the Braves. Lacking Ronald Acuña Jr. and Spencer Strider at the outset of the season, now without Jurickson Profar and Chris Sale, and with a slew of other injuries (Reynaldo López and AJ Smith-Shawver) and some underperformances (Ozzie Albies and Michael Harris II in particular) along the way, they’ve never found a groove for very long. Yet their defense has been excellent.
Their catchers didn’t crack the top three in any of the metrics, but veteran Sean Murphy and rookie Drake Baldwin are both above average across the board, and on pretty even footing relative to one another. Matt Olson leads all first basemen in both DRS (12, one run shy of last year’s majors-leading total) and FRV (6). He’s played every single inning for the team at first base since the start of the 2024 season — and right now it’s paid off, as his offense has rebounded and he’s already matched last year’s 2.6 WAR. Nick Allen, who supplanted Orlando Arcia at shortstop, is the position’s co-leader in FRV (10) and is second only to Taylor Walls in DRS (9); even with a 69 wRC+ to date, he’s totaled 1.1 WAR. Harris is tied for fourth in DRS among center fielders (9) and tied for fifth in FRV (7), but for as strong as those numbers are, his 50 wRC+ (!) has dragged his WAR below zero (-0.3). Spencer Schwellenbach is tied with former teammate Max Fried for the major league lead in DRS among pitchers (6).
Rangers
No team has done a better job of converting batted balls into outs than the Rangers, whose .724 Defensive Efficiency leads the majors and is a big reason why the team has allowed just 3.48 runs per game. Some of that owes to their ballpark; yes, it’s weird that after Globe Life Park was such a hitters’ haven, Globe Life Field has evolved into a pitcher-friendly venue.
Per the advanced metrics, the Rangers don’t have anybody who’s tremendously strong in both DRS and FRV. Adolis García’s 9 DRS is tied for second among right fielders, but he’s average according to FRV. Shortstop Corey Seager (5 DRS, 1 FRV), left fielder Wyatt Langford (5 DRS, 0 FRV), and first baseman Jake Burger (3 DRS, 0 FRV) fit that pattern as well, all while missing time due to injuries. Center fielder Evan Carter leads the team with 3 FRV (to go with 3 DRS) in just 237.2 innings in the field, but both his bat and his health finally appear to be on the right track. Second baseman Marcus Semien (1 DRS, 2 FRV) has been solid, and thankfully his bat showed signs of life in June. Alas, the catching tandem of Jonah Heim and Kyle Higashioka has been in Replacement Level Killers territory overall, with Heim falling off from 5 DRS last year to -5 this year, even while he’s gone from -5 to 1 in FRV.
Yankees
The catching corps of Austin Wells and J.C. Escarra (with a spoonful of Ben Rice) leads the majors with 9.3 FRM, and they’ve been strong in FRV if not DRS. Wells and right fielder Aaron Judge are tied for the team lead with 5 FRV; the latter is back at his natural position after playing just eight games there last year, compared to 105 in center. Cody Bellinger has been at his best in his small sample of right field games, and has netted a modest 3 FRV (with 0 DRS) across the three outfield spots.
The infield has been somewhat unsettled. Jazz Chisholm Jr. was above average at second base (3 DRS, 2 FRV in 251 innings), but has been below average since shifting to third (-3 DRS, -2 FRV in 207 innings), though at least the return of DJ LeMahieu (3 DRS, -1 FRV in 297 innings at second) has helped to offset the move. Even so, the Yankees need to upgrade one position or the other ahead of the trade deadline because they’ve gotten sub-replacement-level offense from whichever position Chisholm isn’t playing. Shortstop Anthony Volpe’s improvement at the plate has been offset by his defensive decline; he’s slipped from 10 FRV and 6 DRS last year to 0 DRS and 2 FRV this year, and had a couple of key misplays in a one-run loss against the Blue Jays on Monday night.
One other bright spot: Yankees pitchers have a major league-leading 16 DRS, more than double the total of the teams tied for second, the Mets and Royals (7 apiece). Beyond Fried, lefty specialist Tim Hill has 3 DRS in just 36.2 innings, and four pitchers have 2 DRS, some while carrying even smaller workloads. The biggest disappointment defensively has been rookie Jasson Domínguez, who has been wobbly in left (-5 FRV, -2 DRS) while also scuffling a bit at the plate.
Cubs
The stellar flychasing of Pete Crow-Armstrong is the biggest reason why the Cubs make the cut here. His 12 FRV ranks second among all center fielders, while his 11 DRS ranks third, but he’s not the only standout defender on the NL Central leaders. Nico Hoerner’s 11 DRS and 6 FRV both lead all second basemen.
While no other Cub has more than 1 FRV, the team is particularly strong in DRS. In addition to the aforementioned players, left fielder Ian Happ and third baseman Matt Shaw both have 6 DRS, catcher Carson Kelly has 5 DRS, and shortstop Dansby Swanson, first baseman Michael Busch, and pitcher Colin Rea all have 3 DRS. As for that 1 FRV, each of the three catchers they’ve used (Kelly, Miguel Amaya, and Reese McGuire) has met that mark, mainly through their throwing, which offsets their slightly subpar framing.
Tigers
The Tigers are the highest-ranked team among those that didn’t wind up on the medal platform in any of the six categories. Their defensive star is starting catcher Dillon Dingler, who has been exceptional in all of the catching metrics under consideration; he’s tied for third in FRV (8), tied for fourth in DRS (6), and is seventh in FRM (3.5). Backup Jake Rogers is above average in all three categories as well.
Elsewhere, it’s tough to take Akil Baddoo‘s 4 DRS in left field seriously given just 32 innings (he’s currently in Triple-A), but no other Tiger is more than three runs above average by either DRS or FRV. Zach McKinstry has netted 3 DRS and 2 FRV while splitting time at second, short, third, left and right, and Javier Báez is at 2 DRS and 2 FRV while playing center field (a new position), shortstop, and third. The latter’s offensive resurgence, in combination with Trey Sweeney’s struggles both in the field (-5 DRS) and at the plate (68 wRC+), has led to Báez reclaiming the regular shortstop job.
Brooklyn-based Jay Jaffe is a senior writer for FanGraphs, the author of The Cooperstown Casebook (Thomas Dunne Books, 2017) and the creator of the JAWS (Jaffe WAR Score) metric for Hall of Fame analysis. He founded the Futility Infielder website (2001), was a columnist for Baseball Prospectus (2005-2012) and a contributing writer for Sports Illustrated (2012-2018). He has been a recurring guest on MLB Network and a member of the BBWAA since 2011, and a Hall of Fame voter since 2021. Follow him on BlueSky @jayjaffe.bsky.social.
I presume that what was meant is that Semien’s bat showed signs of life in *June* (not that he wasn’t good last night too)
Whoops, yes. A consequence of starting this piece when it was still June and not catching the calendar flip (we’ve fixed).