The Hidden Moves of the Offseason
The word “move” is used in the context of an offseason to denote any number of varying transaction types. A trade is a move. A free-agent signing is a move. A player being designated for assignment is a move, or claimed off waivers, or sold to Japan. Players coming and going from rosters are the moves of the winter, and they’re the means by which the public tends to evaluate a team’s offseason.
The calculus for the outlook of the upcoming season is constantly changing throughout the offseason as these myriad moves transpire. When a team signs a star free-agent pitcher, we know that that team is several wins better than they were the day before. When a rebuilding club trades away its slugger in the final year of his contract for prospects, we understand that they’ve dropped a couple wins for the upcoming season.
But there’s another sort of move that happens during the offseason that’s more subtle, and it, too, changes the calculus of the upcoming season, though it often seems to be overlooked. We spend so much time and effort analyzing who “won or lost” the offseason that it’s easy to forget how much change should be expected from a team’s returning players. The Rangers didn’t go out and sign Yu Darvish this offseason, but he is expected to be a valuable addition to this year’s roster, an extra four or so wins added without any kind of traditional offseason move. Without doing anything, the Rangers rotation looks significantly better than it did at the end of last year.
Six years ago, Dave Cameron wrote a short post on this site titled 2009 Is Not a Constant. I recommend you read it, and sub in “2015” for “2009” when applicable, but here’s a relevant passage anyway:
We all know about career years and how you have to expect regression after a player does something way outside the ordinary, but regression doesn’t just serve to bring players back to earth after a big year.
Regression “fixes” a lot of problem spots from the prior year, even if the team doesn’t make a serious effort to change out players. The Royals got a .253 wOBA out of their shortstops a year ago. I don’t care how bad you think Yuniesky Betancourt is, you have to expect that number to be higher this year. They didn’t do anything to improve their shortstop position this winter, but the level of production they got from the position in 2009 is not their expected level of production for 2010.
…
You cannot just look at a team’s prior year won loss record – or even their pythagorean record – make some adjustments for the off-season transactions, and presume that’s a good enough estimator of true talent for the 2010 team.
By now, you’ve got an opinion of most every team’s offseason. You know the Tigers have signed two players to nine-figure contracts, and you’ve adjusted your perception of next year’s Tigers accordingly. You know the Braves have traded away anyone with a major-league uniform left over from 2015, and you’ve adjusted your perception of next year’s Braves accordingly. What you’ve probably spent less time doing is factoring in how much is expected to change at the positions where teams stood pat.
So what I’ve done is taken projected WAR, by Steamer, for every player who’s expected to receive regular playing time this year. For position players, I called it 300 plate appearances, and for pitchers, 100 innings. For all those same players, I calculated the difference between their projected 2016 WAR, and last year’s actual WAR, and I only looked at players who remained on the same team. The methodology might not be perfect here — it’s a summed total, and some teams have eight regulars returning while others have 13 — but this post isn’t about the exact figures, or determining a precise order. This is just about finding teams who can likely expect an overall bounceback from their core group of returning players, or perhaps an overall regression. It’s about reminding ourselves not to forget the hidden part of the offseason’s calculus.
This is something worth thinking about for every team, but we’ll go over a few of the extreme examples below. The chart looks like this:
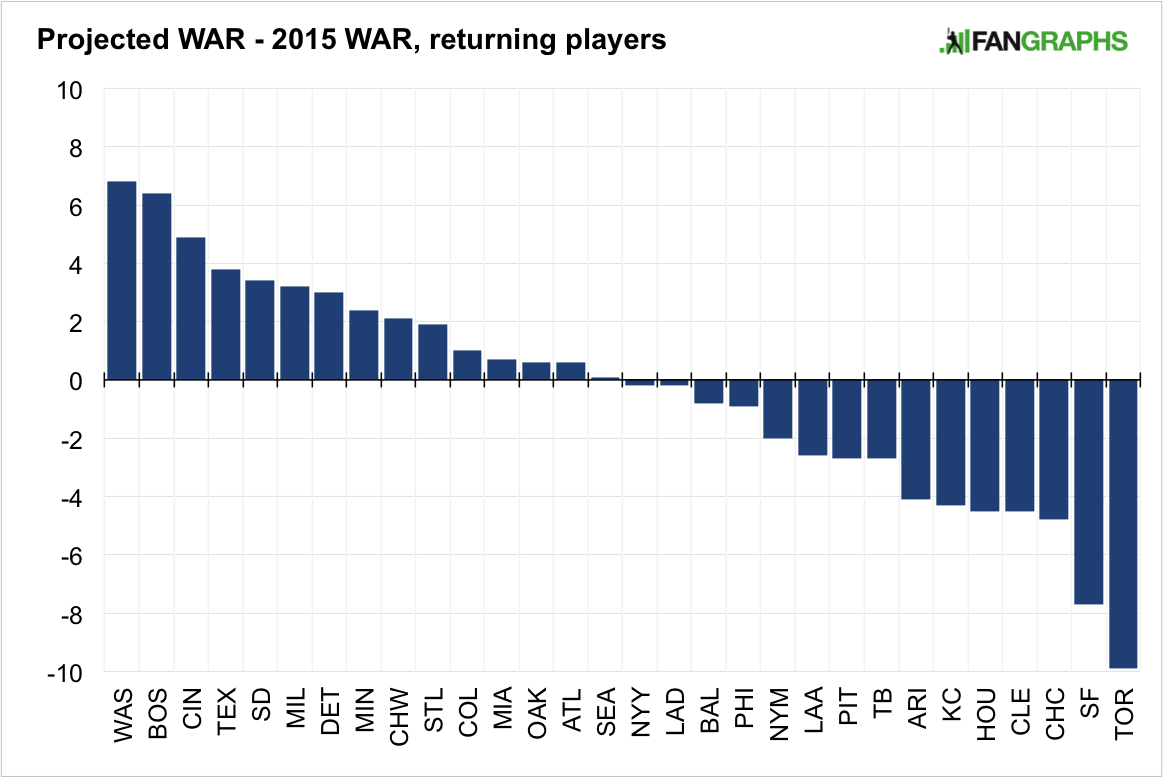
Largest expected gains from returning players
Washington Nationals
- Notables: Anthony Rendon (+2.9 WAR improvement), Stephen Strasburg (+2.0), Jayson Werth (+1.5), Wilson Ramos (+1.3), Tanner Roark (+1.1)
Despite a projected three-win regression from Bryce Harper, because even Bryce Harper shouldn’t be expected to repeat a 10-win season, the Nationals top the list. Which is fitting, because the Nationals were last season’s biggest disappointment, and yet the Nationals are again projected as the best team in the NL East, by a five-game margin. This is the big reason why.
Rendon shouldn’t be expected to miss half the season due to injuries, and assuming full health, he should also be better when he plays. Before the Nationals even made a move this offseason, they could factor in an extra ~3 WAR, just due to a clean slate from Rendon, who looked like an emerging superstar at 25 just a year ago. Strasburg pitched like Clayton Kershaw in the second half, and shouldn’t be expected to have an ERA over five through May again. Extra two wins there. A healthier season from Werth, a better BABIP and more normalized strikeout rate from Ramos and fewer expected home runs from Roark could mix in up to four more wins from the Nats returning regulars.
Boston Red Sox
- Notables: Hanley Ramirez (+3.9), Pablo Sandoval (+3.7), Rick Porcello (+1.9), Dustin Pedroia (+0.8), Rusney Castillo (+0.4)
The Red Sox are basically the American League’s version of the Nationals, what with their 92-win team projection that might appear bullish on the surface relative to their colossal 2015 disappointment. All of which is thanks to the players added during last year’s offseason.
Our opinions of Ramirez and Sandoval should absolutely have changed from where they were when the Red Sox acquired them a year ago. But I don’t think anybody actually believes Ramirez and Sandoval are two of the three worst players in baseball, as they were last season. If you think Ramirez and Sandoval turn in two-win seasons — essentially assuming they’re just league-average starters — you get a nearly eight-win upgrade from last season. A bounceback from Porcello — who underperformed his peripherals at a level that’s jarring, even for him — could add another couple wins.
The Red Sox made headlines by adding David Price and Craig Kimbrel this offseason without having to move any of their major league talent, but the bigger part of their projected improvement is due to the expected upgrades from within.
Largest expected dropoffs from returning players
Toronto Blue Jays
- Notables: Josh Donaldson (-2.8 WAR dropoff), Marco Estrada (-2.1), Edwin Encarnacion (-1.9), Kevin Pillar (-1.8), Ryan Goins (-1.3)
It’s not that Donaldson isn’t expected to continue being a star player. He’s still seen as a top-three position player in the game. It’s just that, like Harper, you can’t expect another MVP season, in January. You can’t expect +9 WAR. It’s more reasonable to expect something closer to +6 WAR, which is still amazing. Then, you’ve got Estrada, who can be expected to regress somewhat from a career year, though I do find Steamer’s projection of him to be overly pessimistic, personally. Encarnacion is 33, and power declines eventually. Steamer doesn’t buy Goins’ sudden spike in walk rate, or Pillar as a true-talent +15 center fielder. Again, that’s not to say Pillar isn’t projected as a plus defender in center — he is — we just can’t reasonably expect that kind of extreme defensive value after just one season as a regular.
San Francisco Giants
- Notables: Brandon Crawford (-2.5), Matt Duffy (-2.0), Gregor Blanco (-1.6), Brandon Belt (-1.6), Joe Panik (-1.5)
Steamer still thinks the Giants have a great infield, just maybe not the best infield in baseball again. Even if you think this looks a bit overly pessimistic, it’s easy to at least see where it’s coming from. Duffy came out of nowhere — an 18th-round draft pick who skipped Triple-A and didn’t do anything in his brief 2014 debut — and turned in a star performance last year. That Duffy is even projected as an above-average starter (+3 WAR) is remarkable, given where he was a year ago, but he isn’t seen as a star just yet. Panik was seen as a low-ceiling player who had never hit in the minors, and turned in a star performance last year. That he’s even projected as an above-average starter (+3 WAR) is remarkable, given where he was a year ago, but he isn’t seen as a star just yet.
As for Crawford, his projection seems particularly bearish. While last year’s power spike was unprecedented and likely unsustainable, he’s significantly outhit his projected wRC+ each of the last two seasons, and the defensive metrics never matched the eye test until this season, which are perhaps unfairly muting his defensive projection. Like Duffy and Panik, Crawford probably isn’t the star-level player he was last season, so you probably wouldn’t be wrong to confidently take the over on 2.2 WAR, but some regression should be expected.
* * *
It’s important not to get too hung up on the particulars of the figures. That’s not the point. The point is that what Dave wrote six years ago is just as true now as it was then. It’s not as simple as starting from a team’s 2015 record, factoring in the major offseason moves and calling it a day. You can’t look at Boston’s 78-win record from last year, and scoff at the notion that Price and Kimbrel will add 14 wins to that. They won’t. But there are reasons to believe the Red Sox will improve substantially in other areas, in areas where they didn’t need to make a move. The expectation shouldn’t be that the entire Nationals roster gets hurt or underperforms in May again. Josh Donaldson won’t be an MVP every season, and Matt Duffy won’t always be an All-Star. Most every team has examples of this. Not to say these things can’t happen again, but the surprises of last year were surprises for a reason. Remember the hidden moves of the offseason.
Note: While Brandon Crawford’s figures were reflected in the original calculation and chart, I accidentally passed him over in the write-up. The post has been edited to correct this.
August used to cover the Indians for MLB and ohio.com, but now he's here and thinks writing these in the third person is weird. So you can reach me on Twitter @AugustFG_ or e-mail at august.fagerstrom@fangraphs.com.
This piece is very well done, yet I feel like it needs a caveat regarding Steamer’s optimistic regression. Those Rendon, Ramirez, Sandoval, and Porcello projections all appear to be on the high side. While those players should contribute more in 2016 than they did in 2015, and therefore are positive “moves” in the sense employed by this column, I doubt they will be as dramatic as the projections suggest.
I buy Rendon and Porcello, but Ramirez and Sandoval contributing 7.6 WAR is a hell of a pipe dream. Steamer doesn’t know that Ramirez won’t even try to be a good defensive first baseman and Sandoval won’t think to decline seconds at the Golden Corral, and will pay $1.99 for his “take home box.”
Ramirez and Sandoval are not projected to contribute 7.6 WAR. Ramirez and Sandoval are projected to contribute a combined 3.7 WAR.
To follow up on what August Fagerstrom said, both players were valued at significantly NEGATIVE WAR last seasons, so most of the plus value comes from just returning to being more than a net 0 player for each. And that’s not especially optimistic.
Yep, I missed that. Thanks.
Guess it’s just a matter of personal preference, really. I don’t think considering Hanley or Sandoval 2-win players is unreasonable.
This may be overly simplistic, but Hanley’s averaged 2.2 WAR over the last three years, and that includes a half-season in 2013 and being the worst player in baseball last year. Considering their terrible seasons were also their most recent seasons, you could certainly argue that Ramirez and Sandoval’s projections, even at just 2 wins, are a bit aggressive. But even if that’s the case, I don’t think it’s by more than a win or so, and the Sox would still be in the mix near the top either way.
As for Rendon, I think there’s a case to be made for taking the over on 3.7 WAR, personally. Again, matter of preference, and the post is more about a reminder of the concept than the particular figures anyway.
Albert Pujols was a two win player this past season. It’s going to be extremely difficult for Hanley Ramirez to reach that level as a first baseman.
Are you going to continue to ignore that Ramirez played almost the entire year last season suffering from the lingering effects of a shoulder injury? One that happened while playing OF (which clearly won’t be the case this season)?
It’s easy to forget that Ramirez was raking before that injury. Last year, he was mondo-atrocious in the fielding department, didn’t get on base, and didn’t hit for much power post-injury. He basically didn’t do a thing.
Figure at 1B that he is less atrocious, that he gets on base closer to his past self, and has more of his usual power. Why is it crazy to figure that he hasn’t completely lost all his skills in the span of a single season?
Ramirez’s 2 WAR Steamer projection is based on him being an even better defensive first baseman than Paul Goldschmidt.
I don’t think it’s at all unreasonable to think that a guy who stuck at shortstop for a decade and played there as recently as 2014 could be a fine defender at first base. Just because he was a disaster in the outfield (a particularly unique outfield, at that) doesn’t mean he’ll be a disaster in the infield — they’re entirely different skill sets.
Completely agree. Steamer’s essentially betting on FanGraphs’ positional adjustments, which do well at estimating WAR but do much worse at guessing how players will do when forced to change positions.
I’d be extremely surprised if Hanley was anything more than an average defender at first. I’m expecting him to be noticeably below average.
Steamer’s projection for Hanley’s defense is downright laughable.
August – hate to do this, but you walked into it buddy:
2015 Projections: “I don’t think it’s at all unreasonable to think that a guy who stuck at shortstop for a decade and played there as recently as 2014 could be a fine defender at first base.”
2014 Projections: “I don’t think it’s at all unreasonable to think that a guy who stuck at shortstop for a decade and played there as recently as 2014 could be a fine defender at left field.”
Playing shortstop, playing first base, and playing left field are completely, completely different. Using positional adjustments to approximate how defense will translate works pretty well for moving around the outfield spots or going from shortstop to second base. It works pretty terribly at estimating how a player will do at a completely new position with none of the same skills as the old position.
In fact, you could even say that assuming a player would transition well to a brand new position because of a positional adjustments actually cost Ben Cherington his job.
I tend to agree with Noah when it comes to positional adjustments. An example I used a couple years ago is this: What would happen if Texas moved Fielder to SS, and Andrus to 1B? According to the positional adjustments, it would be a wash. We all know that reality would look far, far worse from a numbers standpoint. (And far, far better from an entertainment standpoint)
“In fact, you could even say that assuming a player would transition well to a brand new position because of a positional adjustments actually cost Ben Cherington his job.”
Yeah you could actually construct a great argument that the roster Ben constructed last year was one almost specifically designed to sabotage the projection systems by using a whole bunch of broken reclamation guys (Masterson craig shane ogando etc) AND a whole bunch of kids (betts bogey castillo etc) AND old guys (ort uehara breslow) AND a whole bunch of new key contributors with massive risk factors(Panda hanley porcello).
It was almost as if Ben decided to build a team entirely of guys with the riskiest projections possible.
It is unreasonable, especially given that he was a laughable disaster in left field. If Steamer simply wanted to punt on the issue and give Ramirez a league average grade at first base, that would be acceptable, but to give him one of the absolute best defensive grades among first basemen is ridiculous.
I tend to feel people who didnt actually play baseball think this way when in reality it is much easier to move to first than to the of. He used the skillset of fielding grounders and picking short hops at ss while never having to judge flyballs from 300 feet away. There will be some adjustments in the little nuances of the position but i believe he will be at least average by the end of the season.
What percentage of FanGraphs commenters would you guess have never played baseball? I can’t imagine that it’s higher than the single digits.
That wouldn’t surprise me, yet Steamer’s 2 WAR projection has Hanley being one of the very best defensive first basemen in the league.
Seems like the “pro” camp here (including August and Steamer) are using an argument for why HanRam won’t be *bad* at 1B as supporting evidence for the projection… which jdbolick points out a number of times projects him as the BEST 1B…
Given what we know about HanRam, doesn’t it seem most logical to start the projection at somewhere around average for him and go from there?
fwiw, I’d love a list of defensively average / below average infielders from the left side who converted to 1B.
Notably, Pedro Alvarez is a good example of a player who switched from the left side to 1B and ended up WORSE on a relative basis at 1B than he was at 3B.
There are quite a few players who suddenly drastically fall off like Hanley and Panda did last year. It’s not actually all that rare. Happens every year.
And the majority of the time, iirc, they stay broken.
The red sox hilarious 2015 projections counted on all sorts of this kind of dead cat bounce last year from guys like Craig and Victorino and Masterson and unfortunately those players were just broken.
exactly. is a physically capable of playing a fine 1B? sure. was he physically capable of playing passable defense in the easiest LF in baseball? yep, and how did that work out? learning a new position requires someone who is willing to apply himself. he just doesn’t appear to take pride in his defensive game. nothing wrong with his arm, and prior to getting pudgy last season (another question of dedication) there was nothing egregiously bad about his range, and yet his defense has universally been poor regardless of position, coaching staffs, and age.
What kind of caveat? The article is basically just presenting what the projections are indicating. Is the author supposed to cherry pick which projections he doesn’t believe will end up being accurate? He could do that, but that’d be a different article. Are you saying the projections systematically are projecting too much positive regression? Again, that’d be fine to investigate, but different article.
Caveat: jdbolick doubts the positive regression of certain of these players will be so dramatic
I’m saying that the value of regression as presented in the column (Steamer’s fault, not Mr. Fagerstrom’s) is slightly to significantly exaggerated. Steamer, like most projection systems, struggles to deal with players who dramatically overperform or underperform previously established levels, so they will tend to overstate the value lost or gained from subsequent regression. While the column’s point regarding overall value from players doing better or worse than the previous season is well taken, using the extremes probably will not yield realistic representations of that value.
Rendon’s projection looks a lot like his 2014 career season with a little less playing time despite that season appearing to be the outlier. Then as TKDC noted, either Steamer is still calculating Ramirez’s defensive value at third base or else it genuinely believes he will be one of the very best defensive first basemen in the league. Sandoval is projected for his best ISO since 2012 along with an extraordinary rebound in defensive value. Porcello is projected to post the second best ERA of his career, etc.
Or perhaps some people overestimate the how much one good or bad season informs us of a players actual talent level?
If Steamer does this routinely, you can pretty easily patch on your estimates and have an improved system, can’t you?
If that’s not easy, maybe Steamer is making a decent midrange guess after all.
It’s easy to do by hand, yes. It’s much more difficult without manual adjustment.
Systems like Steamer are set up to spit out the numbers based on previous performance without any human input. The advantage of that is to eliminate some degree of bias, but the downside is that you don’t adequately account for all factors. Steamer makes the assumption that Hanley Ramirez should be a very good first baseman based on being adequate at third and shortstop before that. People who actually watched Ramirez know that he’s extremely unlikely to be very good at first base.