The Mets Are Sick and Tired of Being Hit by Baseballs

The chase for history is on, and New York City is awash with excitement. I’m speaking, obviously, of the Mets’ pursuit of the modern era record for times hit by pitch by one team in one season. Mets hitters have been plunked 102 times this year, three shy of the record, and have 14 games left in which to overtake last year’s Reds for the all-time lead.
| Season | Team | HBP |
|---|---|---|
| 2021 | CIN | 105 |
| 2021 | LAD | 104 |
| 2008 | CLE | 103 |
| 2022 | NYM | 102 |
| 2018 | TBR | 101 |
| 1997 | HOU | 100 |
| 2021 | OAK | 98 |
| 2016 | CHC | 96 |
| 2019 | NYM | 95 |
| 2006 | PHI | 95 |
The full list is fun, because two things immediately become apparent. First, most of the high historical HBP totals came in the past five to seven years. And second, whenever a team shows up that isn’t from the mid-2010s or later, it’s immediately obvious which historical outlier is responsible: a Craig Biggio here, a Chase Utley there, a Jason Kendall over in the corner.
The Mets are a more well-rounded lineup, with six players being hit by 10 or more pitches this year. No. 102 came on Sunday afternoon, when Pete Alonso took a fastball off the elbow, causing a benches-clearing incident and earning warnings for both dugouts. The estimable Ron Darling, on the mic for WPIX, sensed that Alonso wasn’t angry because he thought Johan Oviedo hit him intentionally, but because it was the seventh time in that weekend’s four-game series that a Met had been hit. In fact, he said, he couldn’t remember one time this season when a Met had worn a pitch and it looked malicious.
So I went back and watched all 102 Mets HBPs, and he’s right.
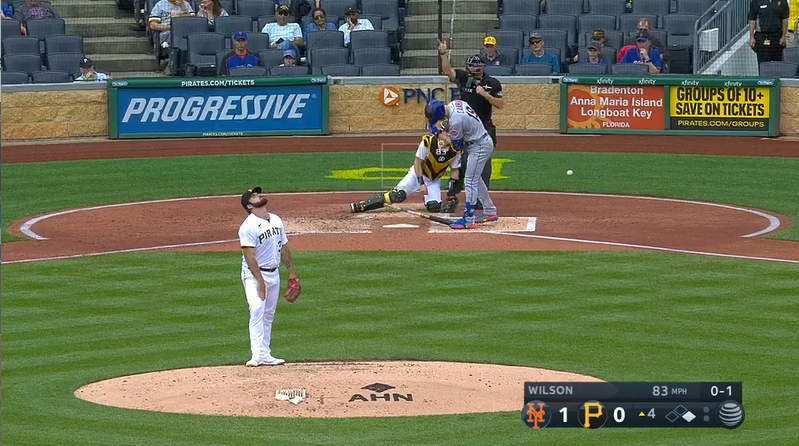
The Mets have been hit a lot, and some of them have been scary: Starling Marte is currently on the IL with a broken finger; Francisco Lindor got hit in the face while trying to bunt; Alonso has taken not one but two pitches to the head this year. But by and large, pitchers who hit Mets batters react with a sort of Charlie Brownish resignation, best expressed by Bryse Wilson, who’s hit three Mets in the past two weeks.
The Mets’ HBP total, 102, is an interesting number because it’s small enough to watch every play in one sitting, but big enough that patterns emerge. Each Met gets hit by a different types of pitches, and each reacts in his own way. Alonso, who wears a big elbow pad, loads for his swing in such a way that he juts his arms down into the zone; that’s how Oviedo got him on Sunday. Lindor, from the left side, tends to wear a lot of back-foot breaking balls that actually hit him in the back foot (it’s worth noting that Lindor is a former teammate of Brandon Guyer, who is the Wilt Chamberlain of getting hit in the legs with a breaking ball).
Mark Canha, the Mets’ leader in HBPs with 21, usually wears pitches in the shoulder or torso, which doesn’t feel great but tends to leave only a bruise. Marte, however, despite being about the same size and hitting from the same side of the plate, always seems to get hit in the hands and wrists for reasons that are not immediately clear to me. It’s a miracle it took him until September to get seriously hurt; he’s got to spend some time this offseason working with Patches O’Houlihan.
As aggrieved as the Mets might feel — and understandably so, since they’ve spent the past six months getting peppered with baseballs — they’re not being targeted. They’re just the leading edge of a leaguewide wave, in which more players are being hit by pitches than ever before.
For historical context, I recommend this 2018 FanGraphs piece by Devan Fink, who noticed that the leaguewide HBP rate had skyrocketed in recent years. His theory about the cause was that pitchers were throwing harder than before and therefore had less command of their pitches. The data neither proved nor disproved that hypothesis, but he did find that relief pitchers were more likely to hit batters than starters. Having looked at Statcast data with four more years’ perspective, I think the specific link to velocity is wrong, but the underlying assumption of the theory — that pitchers are gripping it, ripping it, and occasionally losing it — is on the money.
Having watched all 102 Mets plunkings this year, two common archetypes of the hit-by-pitch stood out. The first was a fastball that tailed in on a same-handed hitter — a right-on-right two-seamer, for instance, that missed its spot and hit the batter (usually Canha) in the ribs. The other was the back-foot breaking ball, which missed its spot and veered right into the batter’s (usually Brandon Nimmo’s or Lindor’s) legs or feet. The funniest example of this phenomenon happened to Brett Baty, who saw a Nick Nelson curveball coming at him and reacted accordingly — only Nelson had thrown the pitch so far behind Baty that when he dodged out of the way, he flung his feet directly into the path of the pitch. If he’d stayed put, the ball would’ve missed him by 10 inches.
Paradoxically, the fastest pitches are the easiest to control. A good four-seamer moves plenty, but not as much as a breaking ball, or even a non-four-seam fastball, which is designed to fool the hitter with movement the way a breaking ball does. These are more likely to be thrown out of the zone on purpose, and more likely to move in a way the pitcher does not intend.
While the Mets have gotten hit by the occasional four-seamer — Canha, bless him, has been plunked by both Hunter Greene and Brusdar Graterol this year — most of the plunkings have been on either breaking balls or non-four-seam fastballs: sinkers, splitters, two-seamers, and cutters. Here are the numbers through Saturday’s games:
| Pitch Type | Total Pitches | Number of HBPs | Percentage |
|---|---|---|---|
| Four-Seamer | 6879 | 24 | 0.349% |
| Offspeed | 2601 | 6 | 0.231% |
| Breaking | 6367 | 32 | 0.503% |
| SSTC* | 6212 | 39 | 0.628% |
The Mets are getting hit by a higher percentage of pitches than the league across the board, but those breakdowns by pitch category hold across the entire league.
| Pitch Type | Pitches | Total HBP | Percentage |
|---|---|---|---|
| Total | 636006 | 1922 | 0.302% |
| Four-Seamer | 209153 | 481 | 0.230% |
| Breaking | 198267 | 622 | 0.314% |
| SSTC* | 154616 | 606 | 0.392% |
Four-seam fastballs are at a 12-year low this season, as a share of total pitches, but we’re on pace for fewer batters to get hit this year than last, despite the four-seamer percentage, which has fluctuated in the low 30s for a decade, going down by 2.4 percentage points. At best, that’s only part of the story. Batters are bigger than ever and stand close to the plate with their elbows protected. Pitchers are producing movement that would’ve genuinely frightened their counterparts from a few decades ago.
While it’s hard to quantify this effect, there are cases like Austin Adams last year, who made 65 appearances for a non-tanking team last year despite hitting roughly one out of every 10 batters he faced and walking another 14.5%. But his gaudy strikeout totals — informed by the same wild movement that made him a danger to opponents — meant he was still a useable reliever.
It’s tough to generate that kind of movement and still hit a target; hundreds and hundreds of pitchers get a shot in the majors each year, and only a handful of those can do both. But the more pitchers are required to make it through a season, and the more accessible wipeout horizontal movement has become, the less predictable those pitches are — much to the peril of Alonso and his teammates, it seems. But that’s what progress looks like in this instance. So either get on board, or, um, get out of the way.
Michael is a writer at FanGraphs. Previously, he was a staff writer at The Ringer and D1Baseball, and his work has appeared at Grantland, Baseball Prospectus, The Atlantic, ESPN.com, and various ill-remembered Phillies blogs. Follow him on Twitter, if you must, @MichaelBaumann.
Great article! Minor nit: I assume the last chart above is intended to be the league-wide rates of getting hit by various pitch types, not the Mets again?