The Most Exciting Team in Baseball
As a baseball fan, winning feels great and losing feels awful. When teams win in dull fashion, fans are generally content to take the wins even if they aren’t all that thrilling. The Astros, Twins, and Dodgers are blowing teams out on a regular basis, but those wins aren’t causing too much consternation. But on the other end of the spectrum are teams that lose a lot of games and fail to provide much excitement during those contests. These are the bad teams that fall behind early and don’t give too much reason in terms of wins and losses to keep following the game. By combining a team’s winning or losing ways with how important at-bats tend to be, we can determine the most exciting team in baseball, as well as the most miserable club.
To determine how often teams have tension-inducing moments, we can take a look at Leverage Index (LI). Our glossary says “Leverage Index is essentially a measure of how critical a particular situation is. To calculate it, you are measuring the swing of the possible change in win expectancy.” A game’s LI starts at 1.0, and the more meaningful plate appearances gets, the higher the index rises; if plate appearances become less meaningful, the index goes lower. Leverage Index shows up on our Play Logs and is on the bottom of our Win Expectancy graphs. Here’s one for Game 3 of last year’s World Series:
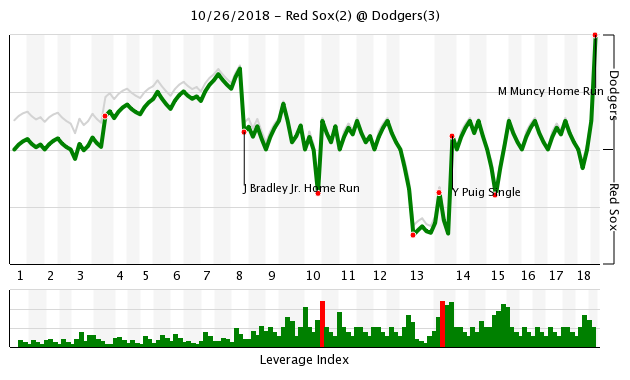
The bars along the bottom identify the biggest moments of the game, even if something big doesn’t show up on the scoreboard. For teams, we are dealing with more than a thousand plays at this point in the season. If we take the average LI of every play, we can see if teams have a tendency to have a decent number of important moments during their games or if things are decided relatively early, with the players playing out games with little chance of changing the outcome.
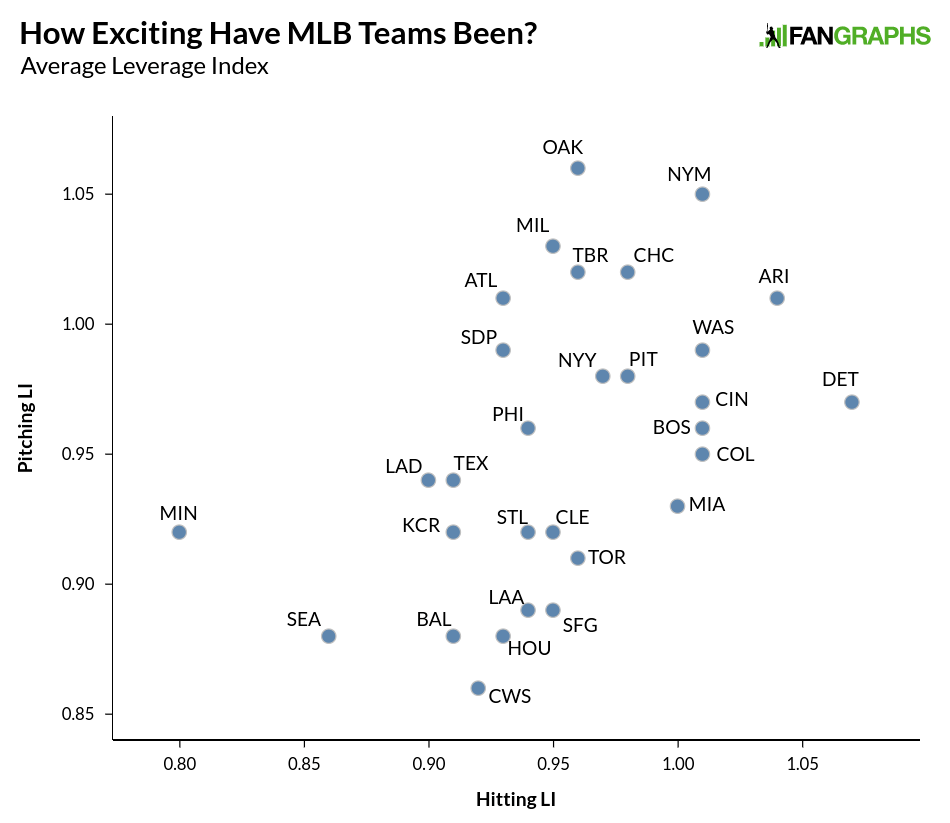
If we separate out hitting and pitching, we can see where most of a team’s drama takes place. The graph below shows all teams so far this season:
We could stop here, and just call the Mets the most exciting team in baseball with the Twins and Mariners the most boring. That doesn’t feel completely right, though. While creating exciting situations is nice, there’s something to be said for actually delivering when the moments get big. Jumping out to an early lead and putting teams away like the Twins have done might lead to a lot of unimportant plate appearances, but the feel-good vibes of putting a team away in the third inning probably last a few innings longer. There has to be a level of fun to the excitement.
To factor in good results with the excitement, let’s add Win Probability Added to the mix. So that we can properly compare Leverage Index with Win Probability Added, I’m going to scale both to 100 and make 15 points one standard deviation away average. For WPA it looks like this:
| Team | Hitting WPA | Hitting WPA Score | Pitching WPA | Pitching WPA Score | WPA Score |
|---|---|---|---|---|---|
| Twins | 5.91 | 122 | 5.09 | 123 | 122 |
| Dodgers | 9.19 | 135 | 1.81 | 110 | 122 |
| Astros | 4.08 | 114 | 5.92 | 127 | 120 |
| Yankees | 4.54 | 116 | 4.46 | 121 | 118 |
| Rays | -0.91 | 94 | 7.41 | 133 | 113 |
| Brewers | 2.32 | 107 | 1.68 | 109 | 108 |
| Phillies | 2.82 | 109 | 0.68 | 105 | 107 |
| Cubs | 2.35 | 107 | 0.15 | 103 | 105 |
| Braves | 3.49 | 112 | -0.99 | 98 | 105 |
| Rockies | 1.06 | 102 | 0.94 | 106 | 104 |
| Rangers | 3.5 | 112 | -2.00 | 94 | 103 |
| Cardinals | 2.21 | 107 | -1.21 | 97 | 102 |
| Padres | -2.12 | 89 | 2.62 | 113 | 101 |
| Red Sox | 1.62 | 104 | -1.12 | 98 | 101 |
| Diamondbacks | -0.83 | 94 | 0.83 | 106 | 100 |
| Athletics | 0.59 | 100 | -0.59 | 100 | 100 |
| Indians | -2.64 | 87 | 2.14 | 111 | 99 |
| Angels | 2.17 | 106 | -2.67 | 91 | 99 |
| White Sox | 2.45 | 108 | -2.95 | 90 | 99 |
| Pirates | 2.59 | 108 | -3.59 | 88 | 98 |
| Mets | 1.66 | 104 | -3.16 | 89 | 97 |
| Reds | -3.32 | 84 | 0.82 | 106 | 95 |
| Nationals | 1.45 | 104 | -4.95 | 82 | 93 |
| Giants | -3.79 | 82 | -1.21 | 97 | 90 |
| Mariners | 1.86 | 105 | -7.86 | 70 | 88 |
| Tigers | -3.87 | 82 | -2.63 | 92 | 87 |
| Marlins | -5.82 | 74 | -1.68 | 95 | 85 |
| Blue Jays | -7.06 | 69 | -1.44 | 96 | 83 |
| Royals | -3.73 | 83 | -6.77 | 75 | 79 |
| Orioles | -4.51 | 79 | -6.99 | 74 | 77 |
This is a simple proxy for wins and losses, and provides the added context of how teams are winning and losing, either on offense or when they take the field. The Twins are pretty balanced, while the Dodgers have leaned heavily on the hitting side and the Rays have needed their pitching and defense. For Leverage Index, the same information looks like this:
| Team | Hitting LI | Hitting LI Score | Pitching LI | Pitching LI Score | LI Score |
|---|---|---|---|---|---|
| Mets | 1.01 | 115 | 1.05 | 126 | 121 |
| Diamondbacks | 1.04 | 124 | 1.01 | 115 | 119 |
| Tigers | 1.07 | 132 | 0.97 | 104 | 118 |
| Athletics | 0.96 | 101 | 1.06 | 129 | 115 |
| Nationals | 1.01 | 115 | 0.99 | 110 | 113 |
| Cubs | 0.98 | 107 | 1.02 | 118 | 113 |
| Reds | 1.01 | 115 | 0.97 | 104 | 110 |
| Rays | 0.96 | 101 | 1.02 | 118 | 110 |
| Brewers | 0.95 | 99 | 1.03 | 121 | 110 |
| Red Sox | 1.01 | 115 | 0.96 | 102 | 108 |
| Rockies | 1.01 | 115 | 0.95 | 99 | 107 |
| Pirates | 0.98 | 107 | 0.98 | 107 | 107 |
| Yankees | 0.97 | 104 | 0.98 | 107 | 106 |
| Braves | 0.93 | 93 | 1.01 | 115 | 104 |
| Marlins | 1 | 112 | 0.93 | 93 | 103 |
| Padres | 0.93 | 93 | 0.99 | 110 | 101 |
| Phillies | 0.94 | 96 | 0.96 | 102 | 99 |
| Blue Jays | 0.96 | 101 | 0.91 | 88 | 95 |
| Indians | 0.95 | 99 | 0.92 | 91 | 95 |
| Cardinals | 0.94 | 96 | 0.92 | 91 | 93 |
| Rangers | 0.91 | 88 | 0.94 | 96 | 92 |
| Giants | 0.95 | 99 | 0.89 | 82 | 91 |
| Dodgers | 0.9 | 85 | 0.94 | 96 | 90 |
| Angels | 0.94 | 96 | 0.89 | 82 | 89 |
| Royals | 0.91 | 88 | 0.92 | 91 | 89 |
| Astros | 0.93 | 93 | 0.88 | 80 | 86 |
| Orioles | 0.91 | 88 | 0.88 | 80 | 84 |
| White Sox | 0.92 | 90 | 0.86 | 74 | 82 |
| Mariners | 0.86 | 74 | 0.88 | 80 | 77 |
| Twins | 0.8 | 57 | 0.92 | 91 | 74 |
Say what you will about the Mets, but they’ve certainly had opportunities to turn games around or stay ahead, even if their season hasn’t completely delivered. Take a look at the Tigers; they might not be winning a ton, but they are playing a lot of competitive games. In fact, if we were to subtract the WPA scores from the LI scores, we’d come up with a few teams delivering more excitement than their wins and losses might indicate. Of course, with that excitement has come disaster, resulting in what I am calling a Horror Score.
| Team | Leverage Index Score | WPA Score | Horror Score |
|---|---|---|---|
| Tigers | 118 | 87 | 31 |
| Mets | 121 | 97 | 24 |
| Nationals | 113 | 93 | 20 |
| Diamondbacks | 119 | 100 | 19 |
| Marlins | 103 | 85 | 18 |
| Athletics | 115 | 100 | 15 |
| Reds | 110 | 95 | 15 |
| Blue Jays | 95 | 83 | 12 |
| Royals | 89 | 79 | 11 |
| Pirates | 107 | 98 | 9 |
| Red Sox | 108 | 101 | 7 |
| Cubs | 113 | 105 | 7 |
| Orioles | 84 | 77 | 7 |
| Rockies | 107 | 104 | 3 |
| Brewers | 110 | 108 | 2 |
| Giants | 91 | 90 | 1 |
| Padres | 101 | 101 | 0 |
| Braves | 104 | 105 | -1 |
| Rays | 110 | 113 | -4 |
| Indians | 95 | 99 | -4 |
| Phillies | 99 | 107 | -8 |
| Cardinals | 93 | 102 | -9 |
| Angels | 89 | 99 | -10 |
| Mariners | 77 | 88 | -11 |
| Rangers | 92 | 103 | -11 |
| Yankees | 106 | 118 | -13 |
| White Sox | 82 | 99 | -17 |
| Dodgers | 90 | 122 | -32 |
| Astros | 86 | 120 | -34 |
| Twins | 74 | 122 | -49 |
As for most exciting, we need to blend the winning with the tense moments. To that end, I’ve taken scores in four components: Pitching LI, Hitting LI, Pitching WPA, and Hitting WPA. With those scores, I found the geometric mean instead of the average to ensure that any one number wouldn’t weigh too heavily on the final number. This is what I found.
| Team | Hitting LI Score | Pitching LI Score | Hitting WPA Score | Pitching WPA Score | Exhilaration Index |
|---|---|---|---|---|---|
| Yankees | 104 | 107 | 116 | 121 | 112 |
| Rays | 101 | 118 | 94 | 133 | 111 |
| Diamondbacks | 124 | 115 | 94 | 106 | 109 |
| Brewers | 99 | 121 | 107 | 109 | 109 |
| Cubs | 107 | 118 | 107 | 103 | 109 |
| Mets | 115 | 126 | 104 | 89 | 108 |
| Athletics | 101 | 129 | 100 | 100 | 107 |
| Rockies | 115 | 99 | 102 | 106 | 105 |
| Dodgers | 85 | 96 | 135 | 110 | 105 |
| Red Sox | 115 | 102 | 104 | 98 | 105 |
| Braves | 93 | 115 | 112 | 98 | 104 |
| Phillies | 96 | 102 | 109 | 105 | 103 |
| Pirates | 107 | 107 | 108 | 88 | 102 |
| Nationals | 115 | 110 | 104 | 82 | 102 |
| Astros | 93 | 80 | 114 | 127 | 102 |
| Reds | 115 | 104 | 84 | 106 | 102 |
| Tigers | 132 | 104 | 82 | 92 | 101 |
| Padres | 93 | 110 | 89 | 113 | 101 |
| Cardinals | 96 | 91 | 107 | 97 | 97 |
| Rangers | 88 | 96 | 112 | 94 | 97 |
| Indians | 99 | 91 | 87 | 111 | 96 |
| Twins | 57 | 91 | 122 | 123 | 94 |
| Angels | 96 | 82 | 106 | 91 | 94 |
| Marlins | 112 | 93 | 74 | 95 | 93 |
| Giants | 99 | 82 | 82 | 97 | 90 |
| White Sox | 90 | 74 | 108 | 90 | 90 |
| Blue Jays | 101 | 88 | 69 | 96 | 88 |
| Royals | 88 | 91 | 83 | 75 | 84 |
| Mariners | 74 | 80 | 105 | 70 | 81 |
| Orioles | 88 | 80 | 79 | 74 | 80 |
It turns out, the Yankees have been the most exciting team to watch in baseball this year, followed closely by the Rays. While the Diamondbacks might not have the best record in the game, they are providing their fans with a lot of good games and enough positive results to rank highly. As for the fans of the Royals, Mariners, and Orioles, my apologies. If you are a fan of the Mariners and you are saying to yourself, “It feels like the team should be even worse than that,” here’s every team’s Exhilaration Index for May.
| Team | Hitting LI Score | Pitching LI Score | Hitting WPA Score | Pitching WPA Score | Exhilaration Index |
|---|---|---|---|---|---|
| Cubs | 117 | 133 | 103 | 110 | 115 |
| Athletics | 109 | 124 | 107 | 112 | 113 |
| Mets | 132 | 131 | 96 | 98 | 113 |
| Yankees | 106 | 100 | 116 | 125 | 112 |
| Rays | 112 | 117 | 84 | 132 | 110 |
| Brewers | 114 | 115 | 91 | 119 | 109 |
| Rockies | 115 | 103 | 125 | 94 | 109 |
| Red Sox | 99 | 110 | 111 | 105 | 106 |
| Braves | 93 | 113 | 101 | 112 | 104 |
| Marlins | 122 | 110 | 87 | 100 | 104 |
| Dodgers | 84 | 98 | 127 | 111 | 104 |
| Phillies | 96 | 98 | 120 | 99 | 103 |
| Rangers | 105 | 102 | 102 | 101 | 102 |
| Diamondbacks | 117 | 114 | 85 | 97 | 102 |
| Reds | 97 | 92 | 103 | 103 | 99 |
| Astros | 73 | 88 | 117 | 121 | 98 |
| Nationals | 103 | 104 | 105 | 79 | 97 |
| Padres | 96 | 95 | 95 | 102 | 97 |
| White Sox | 94 | 88 | 103 | 100 | 96 |
| Angels | 91 | 89 | 111 | 92 | 95 |
| Twins | 71 | 77 | 120 | 122 | 95 |
| Indians | 111 | 85 | 87 | 97 | 95 |
| Giants | 100 | 92 | 97 | 84 | 93 |
| Orioles | 102 | 109 | 89 | 76 | 93 |
| Tigers | 111 | 93 | 84 | 84 | 93 |
| Pirates | 75 | 88 | 117 | 86 | 90 |
| Cardinals | 96 | 86 | 81 | 91 | 88 |
| Royals | 82 | 85 | 83 | 92 | 85 |
| Blue Jays | 96 | 86 | 69 | 87 | 84 |
| Mariners | 79 | 75 | 85 | 71 | 77 |
Nothing above is going to tell us what teams will do going forward, but if you feel a bit dejected watching the home nine, or if their winning doesn’t make you feel as excited as you think it should, there might be a good reason why. For better or worse, being a fan can be a bit draining but these numbers might help put some of your feelings in perspective and provide a rational explanation for the mood of a team’s fans.
Craig Edwards can be found on twitter @craigjedwards.
And this is just one of the many examples of why I love Fangraphs!
This is probably the only use of WPA outside of a specific game that makes sense, but what you did here is awesome.
The “horror score” should be a permanent feature on fangraphs.
Thanks for quantifying my experience with the Mets this year.
Likewise with the Nats. And if you plot the horror score against the preseason projected record, I imagine the Nats would be even more “horrifying” than they already are.
Agreed. The Mets have won and lost in spectacular fashion this year- losing games that were in the bag, making good comebacks, and holding on for dear life.
I think Twins fans will take this. In fact, I’d say they’d like and even lower Pitcher LI, based on the hrumphing about the bullpen.
This is most gooderly. Bordering even on NotGraphs territory. I think further dimension could be added to the exhilaration and horror scores by factoring a team’s preseason expectations. I would submit that a plucky underdog coming up big in big moments is more exhilarating than the Dodgers doing the same. And on the flip side the horrorshow that is the Nationals bullpen is a worse thing to endure than any failure on the part of the Detroit Tigers.
Was thinking the exact same thing re the Nats. I bet plotting their horror score against preseason projected record would be gruesome indeed.
Forget W-L records; this is far more useful in explaining why managers are fired.
Given the bullpen, I thought the braves would be a lot closer to the top of the horror board. But maybe that’s what every fan thinks of their team.
One thing about the win expectacy graph of the WS game above – it really can’t capture the “near misses” when it comes to walk-off homers.
Munch had hit a foul ball that must’ve been like a foot off the foul pole in like the 13th or the 14th inning of that game. W
As a Giants fan I for one am shocked they are as high as they are in the Exhilaration Index
Really enjoyed this.
But doesn’t the WPA really just correlate to the team’s record: WPA hitting + WPA pitching = no. of games games over .500 divide by 2. I know by splitting it into hitting and pitching it will seperate the teams from their record a bit, but the WPA by team looks very similar to just ranking teams by their record.
Should difference from 0 be more important? Surely a great hitting team with an awful bullpen is more exciting, with lots of late rallys, blown leads and then walking it off, than a team who are good at both. Same with a team who can’t hit, but are great at pitching, where each run is really important.
Maybe use WPA+ instead of just WPA?
Having reread the article, WPA makes perfect sense as one of the components – exhilaration is excitment plus winning, I was just going for excitment.
This is awesome Craig. I thought wins and losses were fairly straightforward, but you found a way to make them interesting again (unlike watching the Cardinals in May). Very cool.
this is next level awesome. Ya’ll never disappoint!
Great article–this feels like valuable data in thinking about what makes baseball watchable. Any thoughts on how you might factor in defense–particularly unlikely outcomes? I think it’d also be interesting to bring in pace-of-play or contact rates in an analyis of the most/least fun to watch.
Can somebody please explain how Craig came up with the score numbers? In the article he stated:
“I’m going to scale both to 100 and make 15 points one standard deviation away average.”
What would that look like as a formula?