The National League Has Just One .300 Hitter — and Now He’s Injured
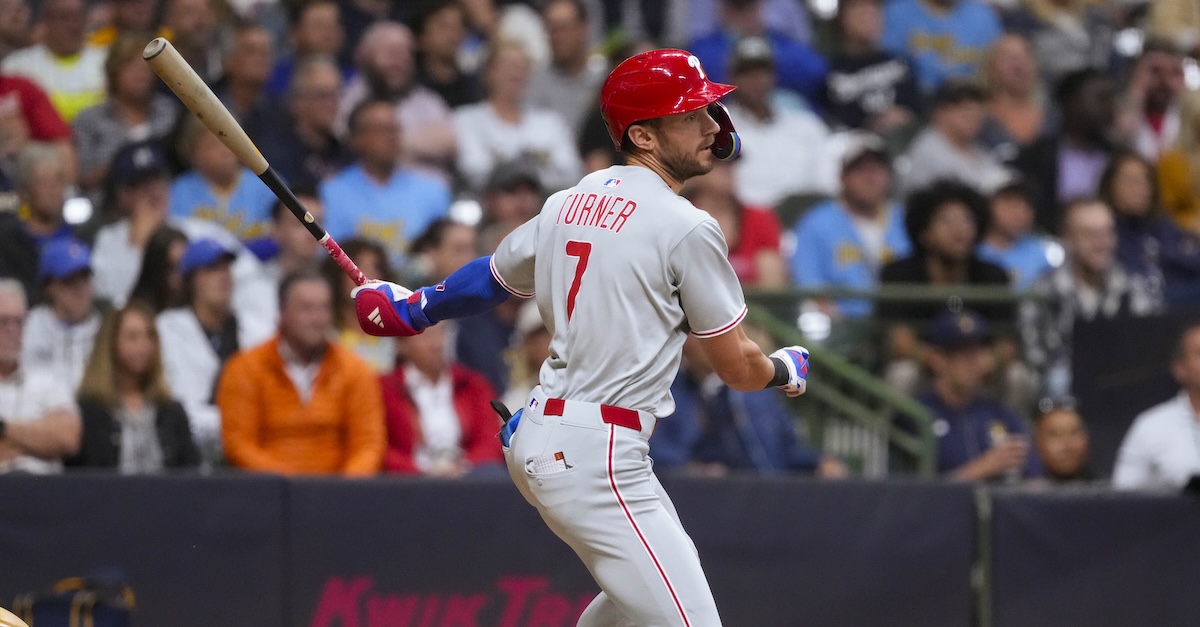
Does anybody want to win the National League batting title? Granted, with all these statheads devaluing batting average and instead offering fancier stats that identify more productive hitters, batting titles ain’t what they used to be. Nonetheless, with less than three weeks to go in the regular season, it bears noting that just one NL qualifier has a batting average of .300 or better, namely Trea Turner — and he just landed on the injured list.
The 32-year-old Turner left Sunday’s game against the Marlins in the top of the seventh inning after running to first base, where he was safe on a throwing error by shortstop Otto Lopez. He felt his right hamstring “grabbing on me,” as he described it afterwards, and was replaced by a pinch-runner. An MRI on Monday showed that he’d suffered a Grade 1 hamstring strain — thankfully not as serious as the Grade 2 left hamstring strain that knocked him out of action for six weeks last season; the Phillies think he could be back after just a 10-day IL stint. Even so, the move came on the same day that the team also placed third baseman Alec Bohm on the IL due to a cyst in his left shoulder; suddenly the Phillies are down half an infield. Luckily for them, they now own an nine-game lead in the NL East.
Thanks in large part to a 4-for-5 night on Friday, Turner is currently hitting .305/.356/.458 (125 wRC+). That’s the highest his batting average has been since June 17 (.308); he was as low as .281 as recently as August 13 but had been on fire over the past four weeks, batting .420/.448/.620 (197 wRC+) since then to overtake Will Smith (who at the time led the NL at .312), Xavier Edwards (.308), Freddie Freeman (.300) and everyone else vying for the title. Turner already has a batting title, having led the NL with a .328 mark in 2021.
Admittedly, this doesn’t matter all that much, but then, what statistic does? Statheads going back to F.C. Lane, who proposed slugging percentage as a better measure of offensive prowess in 1915, and Branch Rickey, who more or less invented on-base percentage in 1954, have provided us with better statistics by which we can measure individual offense, statistics that correlate more closely with run scoring. But as I wrote back in February, I don’t think that means we need to let go of batting average, which serves as an entry point to caring about baseball stats and provides historic continuity that goes back over a century and a half. I won’t rehash that piece here, but I do feel that keeping an eye on the league-wide average is a good way to take the sport’s temperature, because it basically measures entertainment value in volume. Base hits create the action that best captures fans’ attentions.
In that regard, we know the majors have been in the doldrums in recent years, with annual batting averages lower than any we’ve seen since the late 1960s and early ’70s:
| Season | AVG | OBP | SLG | HR/G | R/G |
|---|---|---|---|---|---|
| 1968 | .237 | .299 | .340 | 0.61 | 3.42 |
| 1908 | .239 | .297 | .305 | 0.11 | 3.38 |
| 1967 | .242 | .306 | .357 | 0.71 | 3.77 |
| 2022 | .243 | .312 | .395 | 1.07 | 4.28 |
| 2024 | .243 | .312 | .399 | 1.12 | 4.39 |
| 1972 | .244 | .311 | .354 | 0.68 | 3.69 |
| 2021 | .244 | .317 | .411 | 1.22 | 4.53 |
| 1909 | .244 | .306 | .311 | 0.10 | 3.54 |
| 2020 | .245 | .322 | .418 | 1.28 | 4.65 |
| 1907 | .245 | .305 | .309 | 0.10 | 3.52 |
| 1965 | .246 | .311 | .372 | 0.83 | 3.99 |
| 2025 | .246 | .316 | .405 | 1.16 | 4.47 |
| 1963 | .246 | .309 | .372 | 0.84 | 3.95 |
| 1906 | .247 | .306 | .314 | 0.11 | 3.62 |
| 1904 | .247 | .301 | .321 | 0.13 | 3.73 |
| 1916 | .248 | .312 | .326 | 0.15 | 3.56 |
| 2018 | .248 | .318 | .409 | 1.15 | 4.45 |
| 1905 | .248 | .307 | .323 | 0.14 | 3.89 |
| 1915 | .248 | .317 | .328 | 0.10 | 2.53 |
| 1969 | .248 | .320 | .369 | 0.80 | 4.07 |
| 2023 | .248 | .320 | .414 | 1.21 | 4.62 |
Including the pandemic-shortened 2020 season — presented here for the sake of continuity, though you’re free to toss it out — each of the past six seasons ranks among the 21 lowest in batting average over the past 125 years. Because home run rates are closer to their historical high (1.39 per game, set in 2019), with the 2021, ’23, and ’25 rates respectively ranking fourth, fifth, and seventh in that span, scoring rates haven’t really suffered. This year’s scoring rate is within 0.01 runs per game of seasons as disparate as 1955, ’62, ’77, ’79, and 2016.
We’ve been over the trends countless times. Home run rates are high and batting averages low because of the way the game has evolved, with starting pitcher workloads decreasing because of the advantages produced by fresher arms throwing at higher velocities in shorter stints. Batters are striking out more often, so instead of offenses trying to string together several hits to eke out runs, they’re increasingly swinging for the fences, with uppercuts that produce more homers but also more easily caught fly balls, hence the lower league-wide batting averages. It’s worth noting additionally that MLB, which now owns about a 25% share of Rawlings, has altered the composition of the baseball in ways that have affected both its consistency from ball to ball and more generally how far fly balls carry, which has had an impact on these trends.
I’ve been talking about the combined statistics of the AL and NL, and in the age of interleague play, that makes sense, but since the two leagues are considered separately in terms of awards and honors, it’s worth noting that at times there’s some separation. Here’s a graph of the annual AL and NL batting averages dating back to 1961, the start of the expansion era:
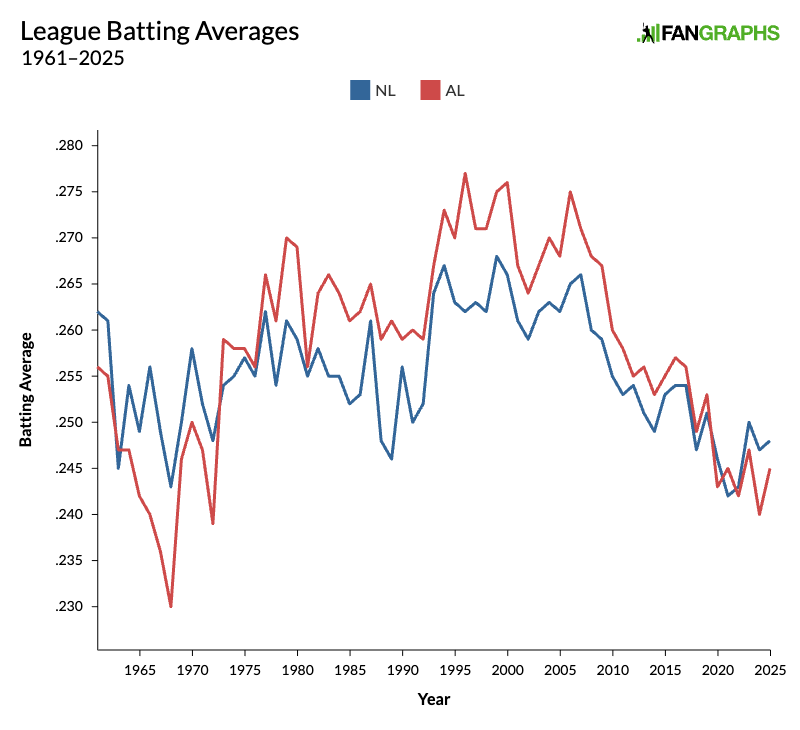
The gaps are exaggerated by the scale of the graph, which is useful given that we’re talking about a comparatively narrow range. The AL, which through September 8 — the cutoff for all of these statistics — had a .245 batting average, hasn’t hit .250 or higher since 2019 (.253), while the NL (.248 as of Tuesday) reached the .250 threshold in both ’19 (.251) and ’23 (.250). Again, we haven’t seen levels so low since the late 1960s and early ’70s. The AL hit .230 in 1968, down from .236 in ’67 and .240 in ’66; though it improved to .246 in ’69 and went even higher in the next couple of years, the .239 average in ’72 was a major factor in the league adopting the designated hitter the next season. The NL was generally higher in those days until the DH came along, and it consistently lagged behind until the past decade; in the days of the universal DH, it’s overtaken the AL.
But despite the AL currently having the lower league-wide batting average than the NL, the Junior Circuit has half a dozen .300 qualified hitters, led by Aaron Judge (.321), with two other hitters posting higher averages than Turner:
| National League | Team | PA | AB | H | AVG |
|---|---|---|---|---|---|
| Trea Turner | PHI | 637 | 587 | 179 | .305 |
| Sal Frelick | MIL | 530 | 471 | 140 | .297 |
| Freddie Freeman | LAD | 552 | 488 | 144 | .295 |
| Brice Turang | MIL | 587 | 522 | 152 | .291 |
| Nico Hoerner | CHC | 568 | 523 | 152 | .291 |
| Kyle Stowers | MIA | 457 | 399 | 115 | .288 |
| Ketel Marte | ARI | 487 | 415 | 119 | .287 |
| Alec Burleson | STL | 476 | 434 | 124 | .286 |
| Will Smith | LAD | 432 | 358 | 106 | .296** |
| Luis Arraez | SDP | 609 | 559 | 158 | .283 |
| American League | Team | PA | AB | H | AVG |
| Aaron Judge | NYY | 594 | 480 | 154 | .321 |
| Jacob Wilson | ATH | 459 | 428 | 135 | .315 |
| Bo Bichette | TOR | 628 | 582 | 181 | .311 |
| Jeremy Peña | HOU | 497 | 451 | 137 | .304 |
| Vladimir Guerrero Jr. | TOR | 601 | 515 | 155 | .301 |
| George Springer | TOR | 500 | 422 | 127 | .301 |
| Bobby Witt Jr. | KCR | 605 | 545 | 160 | .294 |
| Alejandro Kirk | TOR | 451 | 402 | 118 | .294 |
| Yandy Díaz | TBR | 585 | 530 | 155 | .292 |
| Maikel Garcia | KCR | 589 | 527 | 154 | .292 |
Eagle-eyed readers will note the presence of Smith in the NL rankings, albeit with a batting average that does not fall neatly in line with those above and below him. According to a rule introduced in 1967, a player who falls short of officially qualifying for the batting title (since 1957, based on 3.1 plate appearances per team game) is ranked based on “if he were charged with the required number of plate appearances or official at bats” to reach the qualification threshold. Smith, whose Dodgers had played 144 games though Monday, requiring 446.4 PA (which rounds up to 447 for these purposes), was 15 shy of qualifying, so his ranking is based on the batting average he would have if he went 0-for-15 (.283), though he’s not actually charged with those phantom at-bats. For the ninth-ranked hitter in the league, this is trivial, but as I noted, there were points in August where Smith was the official leader even with the extra at-bats; a 2-for-26 skid late in the month took care of that concern. Tony Gwynn won the 1996 NL batting title (.353) while falling four short of the 502 PA needed to qualify; even with an extra 0-for-4 tacked on, he outdistanced Ellis Burks’ .344.
Anyway, while the NL has just one qualified .300 hitter — Turner is the only one with more than Andrew Vaughn’s 209 PA with the Brewers — the AL entered Tuesday with six such players. The combined total of seven qualifiers with a .300 average matches that of last year; the only season with a lower combined total was in 1968, when there were six, including just one in the AL (Carl Yastrzemski at .301).
Qualification thresholds have changed over time. Prior to 1920, a batter had to have appeared in 60% of a team’s scheduled games, while from 1920–37 a 100-game threshold was used. From 1938–44, the AL used a 400-at-bat threshold, while the NL stuck with 100 games, and from 1945–56, the number was based on 2.6 at-bats (not plate appearances) per game. Considering those shifting standards, and counting such hitters in the AL and NL separately, here are the leagues with the fewest .300-hitting qualifiers:
| Lg | Season | Count | Player List |
|---|---|---|---|
| AL | 1968 | 1 | Carl Yastrzemski |
| NL | 2025 | 1 | Trea Turner |
| AL | 1966 | 2 | Tony Oliva, Frank Robinson |
| AL | 1905 | 3 | Harry Bay, Elmer Flick, Willie Keeler |
| AL | 1908 | 3 | Ty Cobb, Sam Crawford, Doc Gessler |
| AL | 1945 | 3 | Tony Cuccinello, Johnny Dickshot, Snuffy Stirnweiss |
| AL | 1965 | 3 | Vic Davalillo, Tony Oliva, Carl Yastrzemski |
| NL | 2022 | 3 | Freddie Freeman, Paul Goldschmidt, Jeff McNeil |
| NL | 2024 | 3 | Luis Arraez, Shohei Ohtani, Marcell Ozuna |
| NL | 1907 | 4 | Ginger Beaumont, Tommy Leach, Sherry Magee, Honus Wagner |
| NL | 1909 | 4 | Larry Doyle, Dick Hoblitzell, Mike Mitchell, Honus Wagner |
| AL | 1943 | 4 | Luke Appling, Doc Cramer, Ralph Hodgin, Dick Wakefield |
| AL | 1963 | 4 | Al Kaline, Albie Pearson, Rich Rollins, Carl Yastrzemski |
| AL | 1967 | 4 | Al Kaline, Frank Robinson, George Scott, Carl Yastrzemski |
| AL | 2023 | 4 | Bo Bichette, Yandy Díaz, Shohei Ohtani, Corey Seager |
| AL | 2024 | 4 | Yordan Alvarez, Vladimir Guerrero Jr., Aaron Judge, Bobby Witt Jr. |
As you can see from the yellow highlighting, this isn’t an entirely new story, as both the AL and NL made the list last year, and each made it once in the previous two seasons. All of this connects to the larger trends discussed above.
It’s worth considering the annual fluctuations and longer-term trends when taking stock of the current situation as it relates to the leaderboards. The more old school way is to calculate how many points each annual league leader is above that year’s league average. When we do, we find that Turner especially stands out:
| Player | Team | Year | League | AVG | League AVG | Dif |
|---|---|---|---|---|---|---|
| Snuffy Stirnweiss | NYY | 1945 | AL | .309 | .255 | .054 |
| Trea Turner | PHI | 2025 | NL | .305 | .248 | .057 |
| Bill Mueller | BOS | 2003 | AL | .326 | .267 | .059 |
| Joe Mauer | MIN | 2008 | AL | .328 | .268 | .060 |
| Edd Roush | CIN | 1919 | NL | .321 | .258 | .063 |
| Fred Lynn | BOS | 1979 | AL | .333 | .270 | .063 |
| Michael Young | TEX | 2005 | AL | .331 | .268 | .063 |
| Pete Runnels | BOS | 1960 | AL | .320 | .255 | .065 |
| Bill Buckner | CHC | 1980 | NL | .324 | .259 | .065 |
| Tony Gwynn | SDP | 1988 | NL | .313 | .248 | .065 |
| Elmer Flick | CLE | 1905 | AL | .308 | .241 | .067 |
| Lou Boudreau | CLE | 1944 | AL | .327 | .260 | .067 |
| Luis Arraez | 2TM | 2024 | NL | .314 | .247 | .067 |
| Jimmie Foxx | BOS | 1938 | AL | .349 | .281 | .068 |
| Willie Wilson | KCR | 1982 | AL | .332 | .264 | .068 |
| Bill Madlock | PIT | 1983 | NL | .323 | .255 | .068 |
| Bernie Williams | NYY | 1998 | AL | .339 | .271 | .068 |
| Buddy Myer | WSH | 1935 | AL | .349 | .280 | .069 |
| Terry Pendleton | ATL | 1991 | NL | .319 | .250 | .069 |
| Dick Groat | PIT | 1960 | NL | .325 | .255 | .070 |
| Justin Morneau | COL | 2014 | NL | .319 | .249 | .070 |
| George Brett | KCR | 1990 | AL | .329 | .259 | .070 |
| Pete Runnels | BOS | 1962 | AL | .326 | .255 | .071 |
| Carl Yastrzemski | BOS | 1968 | AL | .301 | .230 | .071 |
The gap between Turner’s league-leading mark and that of the NL in general is the second-smallest, while last year’s winner, Luis Arraez, is in a virtual tie for the 10th-smallest. Even so, at this end of the table we’ve got players from the tail end of World War II, from the high-scoring 2000s, the 1980s, the Deadball Era… you name it. Meanwhile, Judge’s AL-leading .321 is 76 points above the league, which is in a virtual tie for 44th out of 250 (the 248 batting title winners and two current leaders); among those he’s tied with are Frank Robinson (.316 in the 1966 AL, which hit .240) and Frank Thomas (.347 in the 1997 AL, which hit .271). It’s all over the map.
The other end of the rankings make more sense, as eight of the 12 largest gaps between the leader and the league aren’t just from the 1901–20 span, but from the AL in that period:
| Player | Team | Year | League | AVG | League AVG | Dif |
|---|---|---|---|---|---|---|
| Nap Lajoie | PHA | 1901 | AL | .426 | .277 | .149 |
| Ty Cobb | DET | 1911 | AL | .419 | .273 | .146 |
| Ty Cobb | DET | 1912 | AL | .409 | .265 | .144 |
| Rogers Hornsby | STL | 1924 | NL | .424 | .283 | .141 |
| Ted Williams | BOS | 1941 | AL | .406 | .266 | .140 |
| Nap Lajoie | CLE | 1910 | AL | .383 | .243 | .140 |
| Tris Speaker | CLE | 1916 | AL | .386 | .248 | .138 |
| George Sisler | SLB | 1922 | AL | .420 | .285 | .135 |
| Ty Cobb | DET | 1917 | AL | .383 | .248 | .135 |
| Ted Williams | BOS | 1957 | AL | .388 | .255 | .133 |
| Ty Cobb | DET | 1913 | AL | .389 | .256 | .133 |
| Ty Cobb | DET | 1909 | AL | .377 | .244 | .133 |
| Nap Lajoie | CLE | 1904 | AL | .376 | .244 | .132 |
| Ty Cobb | DET | 1918 | AL | .382 | .254 | .128 |
| Tony Gwynn | SDP | 1994 | NL | .394 | .267 | .127 |
Remember, the AL was a brand new major league then, and while it included its share of players from the NL, the spread in talent between the very best players — Ty Cobb, Nap Lajoie, Tris Speaker — and the average or replacement-level ones was higher than it would ever be. The only comparatively recent seasons at this end of the rankings are shortened ones, namely Gwynn from the 1994 strike season and DJ LeMahieu from the 2020 AL (.364 in a .240 league), though in the range from 104 to 111 points above the league we find some other 21st century hitters, such as Todd Helton from 2000, Barry Bonds from 2002, Chipper Jones from 2008, Juan Soto from 2020, and Arraez from 2023 (.354 in a .250 league).
Another way to measure batting average leaders relative to the league is using our plus stats. Like wRC+ or OPS+, the + is shorthand for an index stat with a baseline of 100, where 120 represents a performance 20% better than average and 80 a performance 20% worse than average. By this measure, Turner isn’t quite as much of an outlier, but he is in a virtual tie for 13th out of 250:
| Player | Team | Year | League | AVG | League AVG | AVG+ |
|---|---|---|---|---|---|---|
| Snuffy Stirnweiss | NYY | 1945 | AL | .309 | .255 | 118 |
| Jimmie Foxx | BOS | 1938 | AL | .349 | .281 | 120 |
| Bill Buckner | CHC | 1980 | NL | .324 | .259 | 121 |
| Buddy Myer | WSH | 1935 | AL | .349 | .280 | 121 |
| Pete Runnels | BOS | 1960 | AL | .320 | .255 | 122 |
| Edd Roush | CIN | 1919 | NL | .321 | .258 | 122 |
| Bill Mueller | BOS | 2003 | AL | .326 | .267 | 122 |
| Tony Gwynn | SDP | 1988 | NL | .313 | .248 | 122 |
| Lou Boudreau | CLE | 1944 | AL | .327 | .260 | 122 |
| Chick Hafey | STL | 1931 | NL | .349 | .277 | 122 |
| Jose Altuve | HOU | 2014 | AL | .341 | .253 | 122 |
| Joe Mauer | MIN | 2008 | AL | .328 | .268 | 122 |
| Bill Madlock | PIT | 1983 | NL | .323 | .255 | 123 |
| Bubbles Hargrave | CIN | 1926 | NL | .353 | .280 | 123 |
| Trea Turner | PHI | 2025 | NL | .305 | .248 | 123 |
| Michael Young | TEX | 2005 | AL | .331 | .268 | 123 |
| Dick Groat | PIT | 1960 | NL | .325 | .255 | 123 |
The names are pretty similar as in the first table, just in a different order. Even with league averages varying by 33 points from lowest (this year’s NL at .248) to highest (the 1938 AL at .281) within that table, there’s not much differentiation in the plus stats. The same is mostly true at the other end, with five Cobb seasons and three Lajoie ones in the top 10, all ranging from an AVG+ of 154 (Lajoie’s 1901) to 148, with LeMahieu (150) in a virtual tie for third.
By either method, Turner being the only .300 hitter, even in a low-average league, stands out. I do think it’s a bit of a bummer that such hitters have become so rare, because it carries a cost in terms of connections to history and to casual fandom. Undeniably, baseball’s audience has shrunk in recent decades, and anyone who still loves the game as deeply as the average FanGraphs reader is no doubt exposed to an increasing volume of cranky-pants complaints about a less watchable product with historically worse players, even if those complaints are off base.
Even setting that aside, the lower-average leagues leave less room for variation from player to player, and fewer routes to success. Even a couple years ago, watching Arraez — who’s nowhere close to being the game’s most productive hitter overall — put up a .354 batting average was fun, and as a bonus his performances helped illuminate Statcast’s relatively new bat-tracking data to understand his proficiency at squaring up the ball, albeit at a lower swing speed than an all-or-nothing hitter like Giancarlo Stanton. Watching Judge chase .400 for the first two months of the season, combining the awesome power of a Stanton with the knack of an Arraez to find grass, was even better.
We know the trends that got us to this point, and we know there’s still some variation within the game, some flukiness. Turner being the NL’s only .300 hitter is at the same time just one of those things and a larger symptom. Baseball will survive, but I do think we could be having more fun.
Brooklyn-based Jay Jaffe is a senior writer for FanGraphs, the author of The Cooperstown Casebook (Thomas Dunne Books, 2017) and the creator of the JAWS (Jaffe WAR Score) metric for Hall of Fame analysis. He founded the Futility Infielder website (2001), was a columnist for Baseball Prospectus (2005-2012) and a contributing writer for Sports Illustrated (2012-2018). He has been a recurring guest on MLB Network and a member of the BBWAA since 2011, and a Hall of Fame voter since 2021. Follow him on BlueSky @jayjaffe.bsky.social.
Four of the current .300 hitters are sons of MLBers. Perhaps the new market inefficiency.
And Turang is close.
They were taught to play the game right.