The Shreds of Some Platoon Insights

I’ll warn you up front: this article is going to be a loose description of some research I’m working on, plus a copious amount of rambling. I’ve been looking for non-handedness platoon effects a lot recently. Partially, it’s because they’re fun to look at. It’s also because the Giants seem to be using some non-handedness platoons to good effect this year — they’re certainly doing more than just picking left or right based on the opposing pitcher.
I haven’t finished exploring this one yet. So why write an article about it? People like to read articles — but also, I get a lot of good ideas from reading the comments (this being perhaps the only site on the internet where that’s a reasonable sentence) and I could use some inspiration in terms of more things to do here. Without further ado, let’s talk inside/outside splits.
Listen to a game, and you can’t miss it. Announcers will tell you that some players are adept at taking an outside pitch and hitting it the other way, or turning on anything inside and giving fans some souvenirs. I split the plate into thirds, then used those thirds to define three zones: anything on the inside third or off the plate inside is “inside,” anything on the outside third or off the plate outside is “outside,” and the rest is the middle.
Here’s something right off the top: Bryce Harper has destroyed inside pitches this year. He’s seen 441 of them and produced 22 runs above average. That counts good takes as well as solid contact, but his batting line is spectacular, too — .367/.480/.735, good for a .497 wOBA. Give him something he can pull, and it’s all over but the crying.
If you can manage to stay on the outer third, you have a better shot. He’s seen 864 pitches out there (pitchers aren’t dummies) and produced 9.2 runs above average, a far lesser line. That’s still solid — he’s an MVP candidate — but it’s nowhere near the scorched-earth stuff he manages on inside pitches.
You could stop here and say “hey, pitchers shouldn’t challenge him inside.” That’s not really how pitching works though. Sure, there are some pitchers who can dot both corners with aplomb, but that’s not the norm. Most pitchers have a strong tendency one way or the other. Jacob deGrom, for example, throws three times as many pitches inside to lefties as he does outside. He locates to his glove side, it works for him, and that’s that.
He’s an extreme example, but many pitchers have a preferred side they throw to, batter identity notwithstanding. If you cut out pitches down the middle, Tyler Glasnow is 60% inside pitches and 40% outside pitches. Zack Greinke ventures inside only 20% of the time — he lives on the outer third 80% of the time (again ignoring the middle, which I’m doing to make the numbers all add to 1).
One difficult thing about parsing these numbers: pitcher handedness is strongly correlated with location. Pitchers mostly work to their glove side, which means that pitches on the outer third are mostly lefty-lefty. Harper, for example, has only seen 102 inside pitches from lefties this year. He’s been great against them — 3.8 runs above average and a .364/.462/.545 line. But that’s worse than his production against all inside pitches, and it raises a question I’m still working on: how can you tease out handedness effects from location effects when the two are clearly correlated?
The most obvious solution is to simply ignore lefty pitchers in my data, and that’s what I’m doing as a first pass. That approach has its shortcomings — it cuts down on sample size considerably, for example — but to simply get some ideas down on paper, it felt like a reasonable first pass.
A few findings on lefty/righty data: Harper is still the best, and he’s hardly alone. Lefties do better on pitches inside than pitches away. In fact, the average player (weighted by plate appearances) is roughly 0.7 runs better per 100 pitches when comparing inner third to outer third. That’s the equivalent of 30 or so points of wOBA, or 20 points of wRC+.
Average isn’t particularly interesting. If all hitters are better on inside pitches, then who cares? You can just ignore any global effect like that, because it will already be baked into results. Inside pitches are, on average, inherently less valuable to opposite-handed batters. I’m more interested in whether this is a batter skill that varies from player to player though, so let’s look into that.
There’s a giant difference between Trevor Larnach (a Harper-esque 4.1 runs per 100 pitches inside, a disastrous -1.7 runs per 100 pitches outside) and Ben Gamel (-2.7 runs per 100 pitches inside, +1.5 per 100 pitches outside). That’s easily the difference between unplayable and solid contributor — if you can isolate a pitcher who throws inside to lefties, Larnach will be great and Gamel will be miserable.
To figure out how much this effect matters, you could do some simple math. Take deGrom as one extreme. Of all the pitches deGrom throws to lefties, 60.8% are inside; only 20% are outside. The average righty throws 32.3% of their pitches to lefties inside and 45.1% outside. That means that Larnach gets an extra 28.5% inside pitches, and sees outside pitches 25.1 percentage points less frequently, when facing deGrom. Compared to his normal overall batting line, that’s the equivalent of adding 1.5 runs per 100 pitches he sees against deGrom, or roughly 65 points of wOBA. That’s a big deal, though not as big of an increase in odds as facing deGrom is a decrease. He’s a good pitcher, as it turns out.
We could, in theory, go through the whole league looking for matchups like this. But we need to do one key thing first: check whether this is random variation or a real effect. You can’t just look at a split and declare its effects to be predictive of what will happen in the future. This one sounds like it might be a real thing, sure, but that’s not good enough. Day/night splits might sound good enough to some, or home/road, or after eating bacon/after eating eggs.
I ran a year-over-year correlation check to see whether the difference in a player’s inside and outside prowess in one year was correlated with that same difference in year two. Last season always makes things difficult, so I ran it over a few different years. Here’s 2020 vs. 2021, with the minimum sample size halved in 2020:
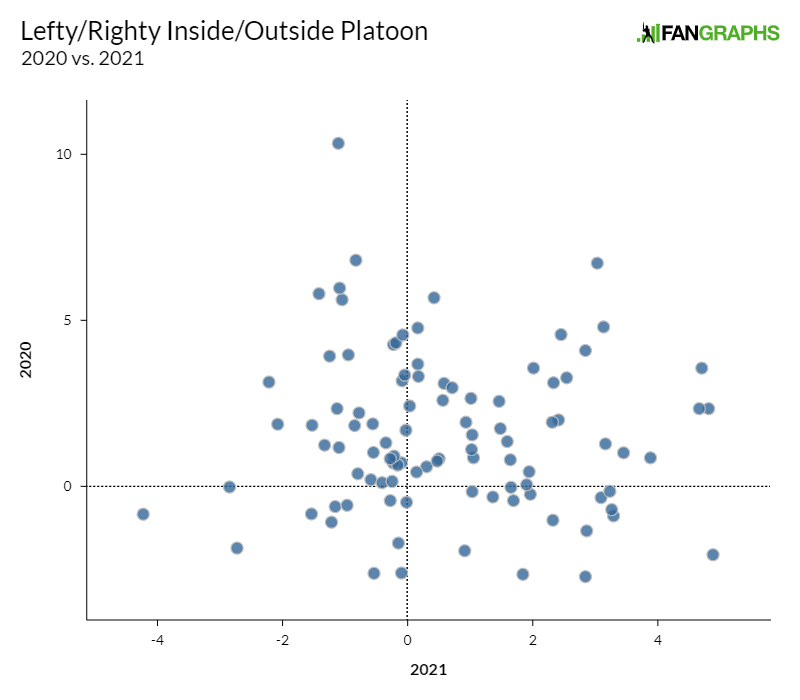
Doesn’t look good! That’s only a 0.01 r-squared, a comically low number. Honestly, though, I expected that data to be bad. It’s way too noisy — 2020 was just so short! Adding a 400-pitch minimum and looking at 2018 vs. 2019 makes for fewer data points, but it doesn’t make the data particularly better; it still looks so much like randomness that I won’t bother showing it, but there’s a 0.05 r-squared, ever so slightly better. That makes sense — to really tease out this effect, you’d want big multi-year samples and better data than simple pitch values.
Where do I go from here? I’m not quite sure, but I’m reasonably sure there’s something worth finding when it comes to pitch location. Since the start of the Statcast era in 2015, Kyle Seager is two runs better per 100 pitches on inside pitches than outside. Eric Hosmer is nearly a run worse against inside pitches, largely because he’s just so good at taking outside pitches and poking them to left; he’s fifth among all lefties when it comes to value added on outside pitches.
Run value isn’t a great metric of this inside/outside success. It’s a noisy statistic, because so much of it is outside the batter’s control; face a string of obvious balls, and your run value will go up. It also suffers from the same problems as any small-sample statistic that looks at results; a few seeing-eye singles getting through can be the difference between a bad and good set of 100 pitches. I’m planning on going back over this more cleanly — either by substituting in expected outcomes (via xwOBA) for batted balls or perhaps by looking for high-value batted balls and whiff rate rather than any outcomes at all.
So there’s more to do! But I thought I’d share this intermediate step, because I’m fairly sure that it’s worth delving into further. I think teams are doing some version of platooning based on pitch location. When done right, it’s a big deal; some players this year show a bigger location split than their handedness split. That’s not to say it is a bigger true-talent gap, or certainly that every player has it.
In fact, I’d guess it’s a small effect overall in most every case. But there are very likely some players whose swing lines up well with certain parts of the zone, and I’m reasonably certain that teams are finding ways to optimize their lineups using it. For the subset of players that is near average but with large splits, this could be the difference between a bat you want in the lineup and one you’d rather avoid. I haven’t come close to cracking it yet — but I’m hoping that I’m on the right track.
Ben is a writer at FanGraphs. He can be found on Bluesky @benclemens.
It seems an even more logical platoon variable would be batters success against pitch types (fastball, curve, etc.) verse pitchers frequency of that type. The old adage of a fastball hitter or a slider chaser.