
The Sinker Paradox
Two things are very much true in modern baseball, and they’re in seemingly direct contradiction with one another. The first hardly requires any introduction: fly balls are leaving parks like never before. There’s almost no point in linking to a story about it, because there’s no way you haven’t heard if you are reading this website, but what the heck, here’s Ken Rosenthal talking about it. Baseball in 2019 is a game of home runs — allow fly balls at your own risk.
At the same time, the two-seam, sinking fastball is going extinct. The trend started a while ago, and it doesn’t look like it’s stopping anytime soon. Cutting sinkers has worked, kind of, and progressive teams like the Astros and Rays are leaning into it. Heck, overhand arm slots and high-spin four-seam fastballs are the hallmarks of modern pitching. Teams are looking for them in draft picks and getting young pitchers to throw more of them.
Think about those two things for a second. Fly balls are more dangerous than ever, but the pitch that is best at avoiding fly balls is on the decline. It’s a mystery worthy of Sherlock Holmes, and today I’m throwing on my deerstalker hat. The first thing we need to do is confirm that fly balls really are worth more than ever. This might seem trivial, but it’s worth doing, if only to figure out just how much more fly balls are worth these days.
Here’s one way to think about batted balls: when you put a ball in play, that’s the result of the plate appearance. Maybe it’s an out, or maybe it’s a double, but that plate appearance is over as soon as a fair ball happens. You can think of the value of a given batted ball as the difference between that batted ball’s value and the value of a random plate appearance. Because of the way wOBA is defined, it’s easy to work out the run value above average of a given event — you simply subtract league average wOBA from the event’s wOBA and divide by a yearly constant called wOBA scale. Take a look at the average value of each batted ball type in every year since 2002:
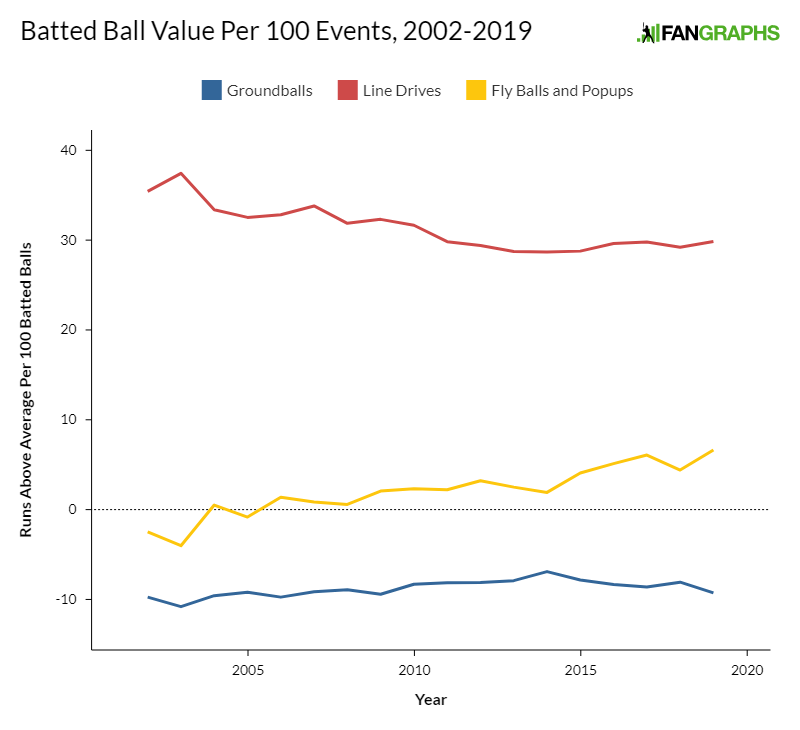
Boy, line drives sure are valuable, so much so that they wipe out the scale. Let’s look at ground balls and fly balls in isolation:
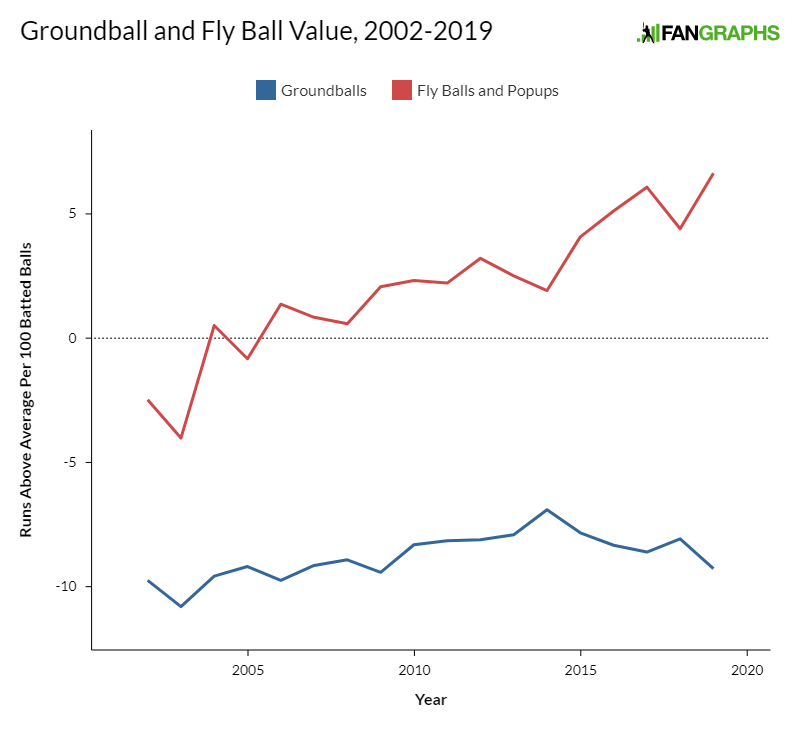
One quick note on the units: I chose to represent it in runs above average per 100 balls in play. It would be totally fine to look at this per single ball in play, but I liked having whole numbers. It’s kind of intuitive, too — in 2019, if you replaced 100 random PA from a league average player with 100 random fly balls, that would be worth just under seven runs. In 2014, 100 fly balls were worth a mere two runs above average. Want the ingredients for an offensive explosion? There you go.
Looking at this data, it’s clear that the new ball is massively changing the relative value of different batted balls. Line drives and ground balls essentially haven’t moved. Meanwhile, fly balls are pure baseball gold now, and they were mere trash as recently as 2014. That brings us to our next question: why are we seeing the decline of the pitch best suited to avoid fly balls at the same time that fly balls are most important to avoid?
First things first — what if sinkers just aren’t generating the same amount of ground balls as before? There’s been a lot of talk about newly designed swings that lift sinkers into fly balls. If that’s the case, maybe the changing value of fly balls doesn’t matter, because some of the ground balls sinkers are trying to get are transforming into home runs. Let’s take a look at the batted ball rates of sinkers over the last twelve years:
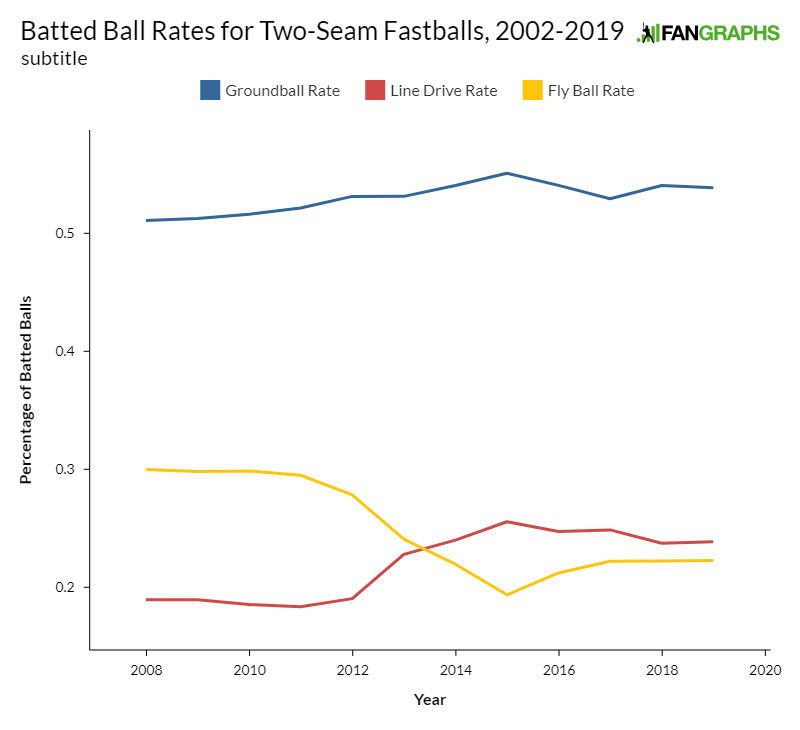
It looks like not much has changed in the past few years. There appears to be some bleed-through between line drives and fly balls, but aside from that switch, things have been quiet. Even in that case, rates have stayed pretty constant since 2015.
What do these rates mean in terms of run scoring? We can combine the batted ball percentages with the value of each batted ball type we calculated up above and work out the amount of runs above average sinkers allow per 100 balls in play, accounting for the different batted ball distribution and value in each year. Here’s that result, with four-seamers in the graph for comparison’s sake:
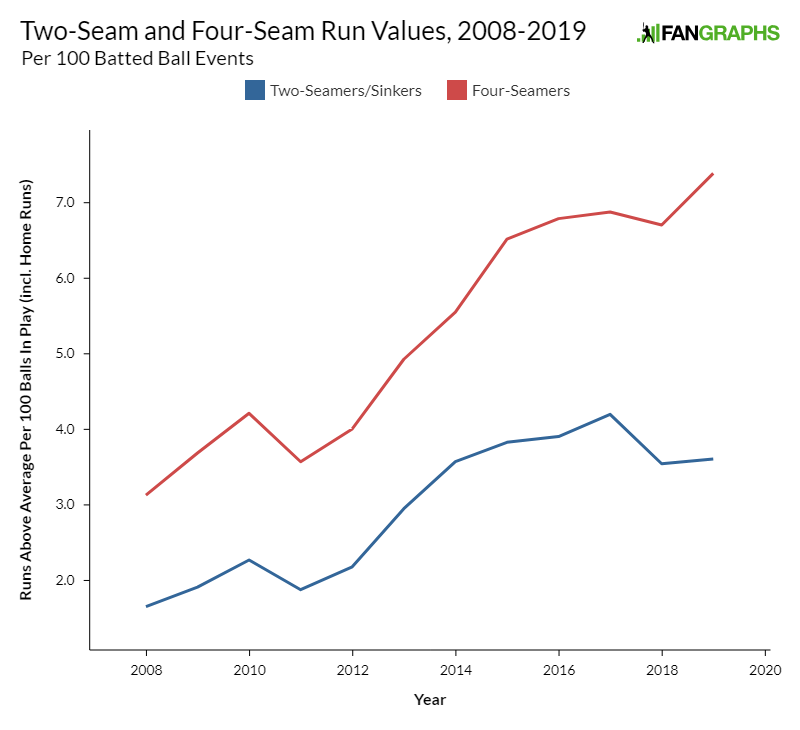
Curiouser and curiouser. Sinkers were more valuable than four-seamers in 2008, but their advantage narrowed somewhat as batters turned more of them into line drives. The recent fly ball value explosion, however, has made sinkers significantly better for the pitcher again. Why, then, aren’t we seeing more of them?
There are at least three huge effects that I haven’t addressed so far, without which no analysis would be complete. First, consider that 17% fewer sinkers were thrown in 2018 than in 2008. It stands to reason that getting rid of those presumably bad sinkers would flatter the overall sample. We can handle that by slicing up the data and focusing on one segment. Next, there’s something even more obvious: not every pitch results in a ball in play. Just 20.3% of sinkers thrown this year have ended up in play, compared to 15.8% of four-seam fastballs. We can work out rough values of balls, strikes, and fouls and add those values to our analysis. Finally, who’s to say that fly balls hit off of sinkers and fly balls hit off of four-seam fastballs are created equally? We can check that as well.
First let’s equalize our samples. In each year from 2014-18 (the start of the downtick in two-seam fastballs), I looked at the pitchers who accrued the 51st-75th most value from their sinkers, per Pitch Info’s run values. Then I looked at the batted ball results those pitchers had in the subsequent year. In this way, there’s no selection bias problem — if I simply looked at the 51st-75th best sinkers in a year and took those batted ball rates, I’d be contaminating our data, because we already roughly know how valuable those sinkers are. Why 51st-75th? Well, I’m not convinced there’s much value to be gained from looking at the singular greatest sinker throwers. Maybe they’ll follow the population as a whole, but then again, maybe not. I’m looking for pitchers who have reason to keep throwing the pitch, but who aren’t outliers. We’ll repeat the process for four-seam fastballs to end up with a comparable group.
| Year | GB% (Overall) | LD% (Overall) | FB% (Overall) | GB% (51-75) | LD% (51-75) | FB% (51-75) |
|---|---|---|---|---|---|---|
| 2015 | 55.1% | 25.6% | 19.4% | 55.4% | 26.1% | 18.5% |
| 2016 | 54.1% | 24.7% | 21.2% | 53.9% | 25.1% | 21.1% |
| 2017 | 52.9% | 24.9% | 22.2% | 57.1% | 22.8% | 20.1% |
| 2018 | 54.0% | 23.7% | 22.2% | 53.5% | 24.5% | 22.0% |
| 2019 | 53.9% | 23.9% | 22.3% | 55.4% | 22.7% | 21.9% |
| Year | GB% (Overall) | LD% (Overall) | FB% (Overall) | GB% (51-75) | LD% (51-75) | FB% (51-75) |
|---|---|---|---|---|---|---|
| 2015 | 38.5% | 28.4% | 33.1% | 39.4% | 28.5% | 32.2% |
| 2016 | 38.0% | 27.7% | 34.4% | 35.6% | 26.2% | 38.2% |
| 2017 | 37.2% | 26.4% | 36.4% | 31.9% | 27.1% | 41.0% |
| 2018 | 34.9% | 26.8% | 38.2% | 33.5% | 26.9% | 39.6% |
| 2019 | 34.9% | 27.2% | 37.9% | 35.9% | 27.2% | 37.0% |
There doesn’t appear to be anything when it comes to batted ball splits. The sub-population of 51st-75th best pitchers with both fastballs are worth about the same as the overall group, easily within a margin of error, from 2015 to 2019. Two-seamers put in play are better for pitchers, relative to four-seamers, than they were in 2014, and it’s not just a selection effect. If we’re going to find an answer, it’ll be somewhere else.
Next, let’s add in balls and strikes. One reason that four-seam fastballs are gaining prominence is because balls in play are increasingly dangerous. Four-seam fastballs generate more swings and misses, which means that putting the two pitches on an equal axis of balls in play isn’t telling the whole story. Take a look at swinging strike rate, called strike rate, and foul ball rate for the two types of fastballs since 2008. Of note, I calculated but am not going to show these splits for the sub-sample from the previous section, because they’re indistinguishable from the overall population.
| Year | SwStr% (2Seam) | CS% (2Seam) | Foul% (2Seam) | SwStr% (4Seam) | CS% (4Seam) | Foul% (4Seam) |
|---|---|---|---|---|---|---|
| 2008 | 5.4% | 18.7% | 17.6% | 7.3% | 18.7% | 19.7% |
| 2009 | 5.2% | 19.3% | 17.2% | 7.3% | 19.1% | 19.5% |
| 2010 | 5.4% | 19.9% | 17.1% | 7.4% | 19.8% | 19.4% |
| 2011 | 5.4% | 19.5% | 17.2% | 7.4% | 19.6% | 19.8% |
| 2012 | 5.8% | 19.9% | 17.2% | 7.9% | 19.7% | 11.4% |
| 2013 | 5.9% | 19.4% | 17.6% | 8.0% | 19.5% | 19.8% |
| 2014 | 6.1% | 19.6% | 17.7% | 8.1% | 19.5% | 20.2% |
| 2015 | 6.2% | 19.0% | 17.9% | 8.6% | 18.7% | 20.6% |
| 2016 | 6.4% | 18.8% | 17.9% | 8.8% | 18.6% | 20.7% |
| 2017 | 6.4% | 18.9% | 18.2% | 9.2% | 18.2% | 20.8% |
| 2018 | 6.6% | 19.3% | 17.9% | 9.6% | 18.4% | 20.7% |
| 2019 | 6.8% | 20.1% | 18.3% | 10.2% | 19.1% | 20.7% |
With these results in hand, it would be tempting to work out the average run value of a strike, foul, or ball. Then we could just apply those values and go from there. The only problem with this analysis is that it doesn’t quite work that way. The average value of a strike is heavily influenced by turning, say, a 3-2 count into a strikeout. But the called strikes in our sample aren’t distributed evenly. Batters take a lot more strikes 0-0 than with two strikes. Instead, I’m going to focus on results when the batter swings. This comes a lot closer to a fair representation of pitch value.
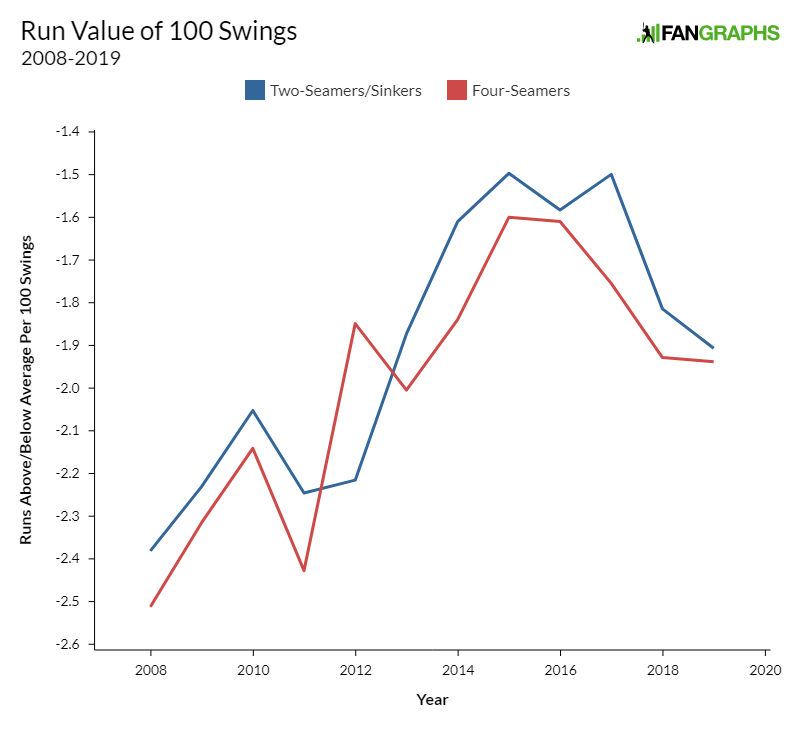
This analysis is enlightening. The edge that two-seam fastballs produce on balls in play is real, but four-seam fastballs are so much better at producing whiffs and foul balls that they more than make up their contact disadvantage. Even though it seems like getting grounders is all you need to make a pitch worth it in this era of Death Star-level fly ball production, the rest of the outcomes matter too.
I have a confession to make. I just spent 1,500 words showing that sinkers aren’t more valuable than four-seam fastballs in a world where batted ball results are random. There’s just one problem: batted ball results aren’t random. Take a look at the wOBA value of fly balls hit off of two-seam and four-seam fastballs, respectively, since 2008:
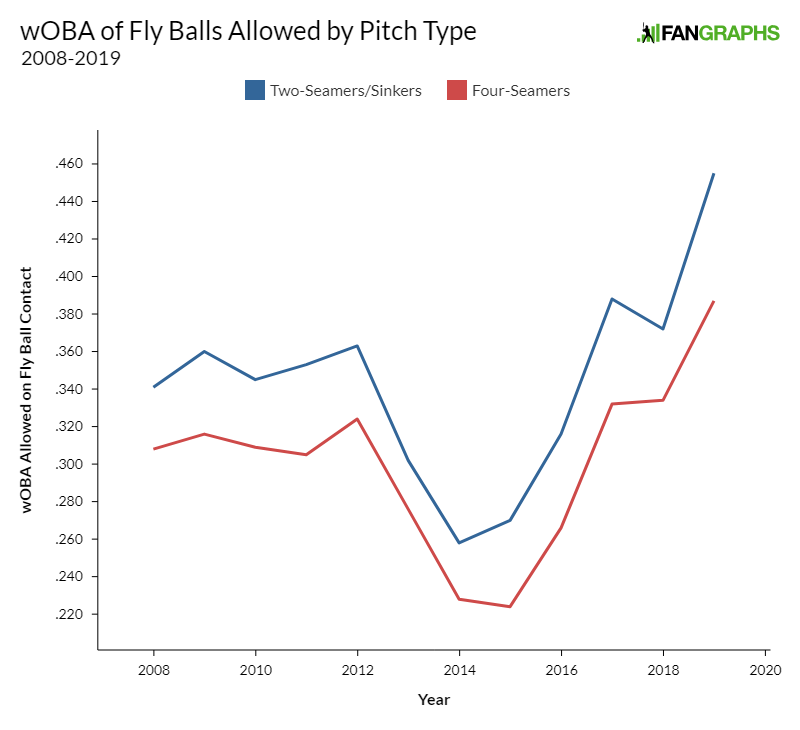
Oh. That looks like it might make a difference. Let’s redo the study from above, only plugging in the specific wOBA allowed for each pitch type/batted ball combination. First, the value of 100 batted balls:
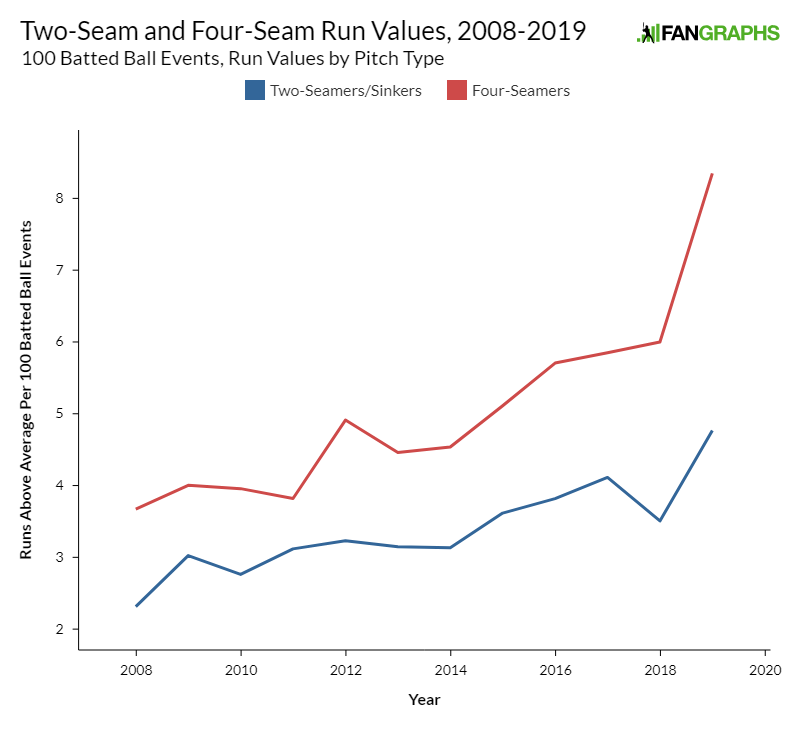
Four-seam fastballs have been particularly bad for pitchers on balls in play this year, but for the most part this analysis makes sinkers look worse than they did before we segmented the batted ball results. Let’s finish the thread by throwing these new batted ball values into a calculation of runs per 100 swings:
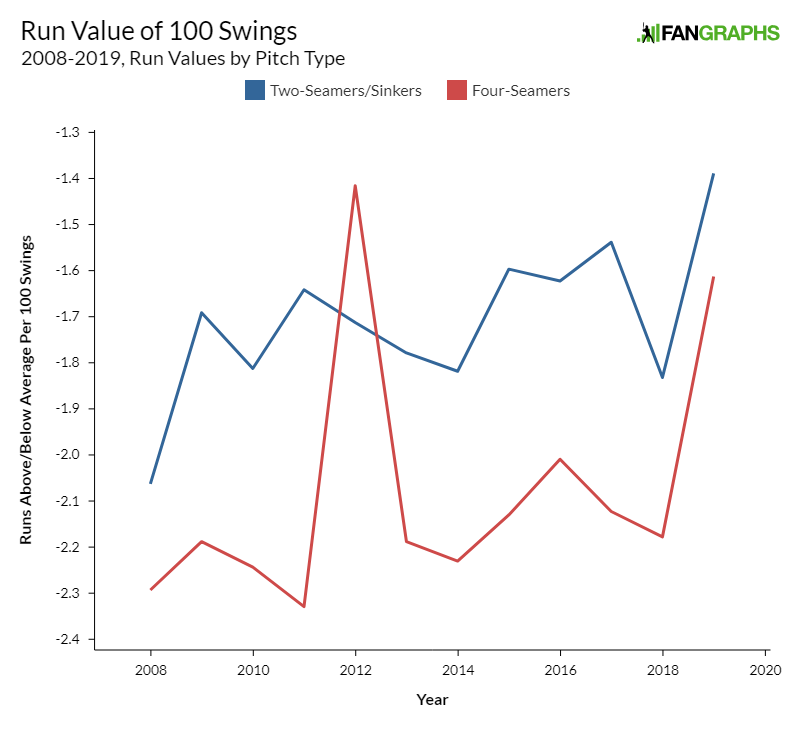
I’m usually hesitant to say “there you have it,” but… there you have it. Even when balls in play were less onerous for pitchers, the swing-and-miss properties of four-seam fastballs gave them an edge in overall value. That edge appears to still exist, even as fewer pitchers throw two-seam fastballs and the ball carries further and further.
The sinker paradox is fun to think about. Grounders are good, but sinkers are bad. What gives? I posit three reasons in this article. First, batted balls off of sinkers aren’t as advantageous as you might think. Second, batters do more damage when they put a sinker in the air than when they put a four-seamer in the air. Third, sinkers induce very few whiffs relative to four-seamers, and in the lively ball era, getting an out without allowing contact is paramount.
These aren’t the only possible reasons for the decline of sinking fastballs, of course. Matt Trueblood did some interesting analysis that points to sinker pitch tunneling being less favorable than four-seam tunneling. More specifically, curveballs have been regaining popularity relative to sliders, and four-seam fastballs pair better with curves than two-seamers do. Batters may have changed swings to more effectively target sinkers, though that hasn’t really showed up in the data in any obvious way.
There are, in other words, many reasons you might expect sinking fastballs to decline in popularity. Getting more grounders isn’t enough. Two-seamers need to get enough more grounders to offset their disadvantages in several other categories, and thus far, it doesn’t appear that they have. This is a lesson in baseball, but it’s also a lesson in logic. Two effects work in offsetting directions all the time (more grounders, less whiffs). If you want to know the net effect, it’s not enough to say that two things point opposite ways. You have to go in and work out the differences if you want to be able to say anything more than “well it’s confusing, that’s for sure.”
When it comes to baseball, it looks like the league has done an excellent job working out the net costs and benefits of various fastballs. This is subject to change, of course, as swings and run environments change. For now, it all makes sense: two-seamers are worse, all-in, and so they’re getting thrown less. If only every cost-benefit analysis had such a clean answer.
Ben is a writer at FanGraphs. He can be found on Bluesky @benclemens.
I believe the last bastion for the 2-seamer is in Pittsburgh, PA.
Why? Pittsburgh has only the 14th highest sinker percentage this year. It’s the Brewers, Cubs, and As leading in sinkers by a decent margin.
I want one of those overly dramatic culture pieces on the last bastion of sinkerdom in Pittsburgh from NY Times like how they do w/ anything that has to do w/ LA or Asia
San Francisco too. “Bruce Bochy remembers when the burrito stands filled the Mission, an average couple could afford to rent a house in the Sunset, and Tim Lincecum was getting people out with sinkers.”
Like you alluded to in the third to last paragraph, batter’s swings have changed. Much has been made of players like Bellinger and Gallo successfully using an uppercut swing to generate more flyballs and, by extension, more homeruns. Could it be as simple as more hitters now employ swing paths that, for lack of a better word, “match up” better with sinkers?
EV doesn’t match the angle which the bat comes through the zone – its a round ball and a round bat. Do they really have dramatic uppercuts? I get your point, but what we call an uppercut isn’t really that different a swing path from a normal swing. Every swing stars downward and finishes headed up.
This is the correct question and it doesn’t just relate to the sinker. Baseball has finally recognized that hitting down on a pitch is counter-productive and attempting to match swing plane with pitch plane is the correct approach to hitting. With this knowledge it is easy to see many modern hitters taking this approach. Your mention of Bellinger and Gallo is very accurate as they are two of the leading exponents. That doesn’t mean it is easy because pitchers are constantly trying to get their pitches to change plane while the ball is traversing the distance between the mound and the plate but, at least, the hitter isn’t making it harder than it already is. For reasons that I will never understand, the teachings of Ted Williams, who advocated a slightly upward plane, were ignored for years and years and techniques that actually defied the Laws of Physics were taught. It is my belief that if velocity had not suddenly jumped that hitting would be taking over the game completely with the better understanding of the mathematics that govern bio-mechanics and ball flight. But then again, after last weekend’s series in Colorado, 16-12. 14-8 and 14-13, maybe it has.
I have often thought about how Ted Williams was ignored for so long as well. I remember twenty years ago someone saying that if you wanted to get Ted all riled up tell him a downward swing plane is the best, so it’s not like he didn’t think this was extremely important.
Since his playing days the mound has been lowered twice, so it was even more important back then…but hey…this is how we’ve always swung at the ball and it’s worked so far, why change?
Great stuff.
One thing I wonder about regularly is if pitchers, knowing hitters are looking to get it in the air, are now working harder to purposely induce infield pop-ups. Those outcomes are just as good as a strikeout, even better outcomes if it’s early in the count. If hitters are looking to hit the ball in the air, from a game theory standpoint why not hang them with their own noose? I was thinking that might be part of the equation in that graph of “wOBA allowed on fly ball contact.” If you hit a fly ball on a sinker, I would intuitively think it’s harder to hit an infield pop-up.
I am sure they are. Elevated 4FB have never been more popular.
Yes they have!The high hard one was the backbone of virtually every pitchers arsenal back before the strike zone was lowered some time in the 70’s. When coupled with faulty theories on hitting, pitching down in the zone made all the sense in the world so high heat disappeared. It was usually called a ball so what reason did a pitcher have to throw it. It is interesting to me, who has watched the game since the 40’s, to see high heat followed by a curve in the dirt return to the pitcher’s repertoire.
Great stuff as usual, Ben.
Great article. Great job handling complicated data in a way that even i can understand.
Tom Tango said in his book that fb hitters do well against GB pitchers and GB hitters do better against FB pitchers.
The explanation might be that this creates a happy medium. The FB hitter lifts the GB pitcher enough to create damage. He still won’t hit a ton of fly balls but if he does it is crushed at a low FB angle (20-25 degrees) which is very productive.
The FB hitter however matched up against a FB pitcher often hits it too high because his loft and the loft of the FB pitcher adds up at least in theory, so he hits a lot of high FBs (35-50 degrees) which is not so productive while the low LA hitter gets elevated by the FB pitcher enough to do damage.
One of the fantasy guys here (might have been eno) said a GB pitcher must have like 60% grounders to be really suppressing homers because the 50% grounder guys give up less FBs but if they do it is nuked hard so there are not much less overall homers.
So being a GB pitcher might not he a recipe for success anymore unless you are really extreme, the high FB guys don’t win by suppressing homers but by limiting the damage around the homers, i.e. make sure the one bomb per game they give up is a solo shot by limiting contact and ideally walks as well as getting some pop ups and weak contact.
Was there any indication of how this stacked up against the handedness match-ups? Teams might choose to give even a good LHB the day off against a good LHP, in favor of an (overall) lesser RHB because of the platoon advantage.
Is this GB/FB thing significant enough that managers should be taking it into account at all (or so minor that you’d always just go with the best lineup available otherwise)? Or is it at the level, that managers shouldn’t mostly replace their LvR “days off” with GBvFB “days off”?
The effect was slightly smaller than the platoon advantage, so definitely a relevant factor. Worth noting that nowadays, ball clubs have significantly more granular information about how hitters swing paths are likely to match up against any given pitcher, so raw GB/FB splits are probably not so useful.
Today, I learned what a deerstalker hat is.
Also, all the other good stuff.
Are double play balls picked up by “runs above/below avg.”? Sinkers are better at generating DP grounders, but with a drop of about 14% in singles +BB from 2015 to 2018, the need for a good sinker seems to have also declined.
They are not. That’s definitely worth adding in at some point as well.
Great article once again, Ben. It amazes me that catcher (or signal callers) are extending the correct number of fingers, without the benefit of this enlightening data. I am always amazed how baseball decisions are so well grounded in ostensibly complicated and enigmatic statistics. It’s almost like good signal callers have a “feel” for the data.
As a retired stats prof, I wonder why we don’t teach more stats through a baseball lens. My only concern lies in significance. Why don’t Sabermetricians include tests for significance? That is, even though you obtain more wOBA on a certain pitch, is that finding significant, or due to chance, or even the correct choice of the sample.
Love this stuff…
As a former Stats TA and occasional instructor, I can give one answer why more Stats aren’t taught using baseball examples – students don’t know baseball at a high enough %. I remember the nightmare of having to explain to a foreign student what a deck of cards was, and a die as well, just to complete intro level questions. Having to explain baseball to an audience who doesn’t know it, quick enough for that week’s lesson or assignment? Good luck…
We should teach them baseball while we’re at it.
Win-win
There’s a gendered component (and maybe by class and family background) to this as well. There are definitely a fair number of hardcore woman baseball fans, but in your stats class (okay, at least in my stats classes) there will probably be zero. Given all of the ink given to closing the gender gap in STEM I don’t think this is particularly good pedagogy.
This is a good question. I’ll quickly report the significance here. Over one year, only one of the gaps is significant at the 95% level- for a rule of thumb, stdev of one year’s data is about .3 runs per 100 swings. Over the entire sample, the result definitely looks significant, and I think a bigger issue there is whether the sample is correctly chosen. I’m honestly not sure it is, but that’s something I was concerned about in this study for sure.
You watch much baseball? The pitches rarely end up being executed as called. Good pitches get destroyed, terrible ones end up being backwards Ks. I am not sure it is as complex as you think.
I like that the article investigated several potential causes to the decine in Sinker usage. But the one I personally found fascinating was the tunneling argument. 4seam fastballs pair better with curves while Sinkers and 2seam fastballs pair better with circle-changes. So, fastball usage could be very closely correlated to secondary pitch usage.
I think this is an interesting point. Perhaps the effectiveness of the curveball vs the slider in the current run environment needs to be included as well because a 4 seam fastball is typically going to be paired with a curve ball. So the evaluation should be the effectiveness of the 4-seam FB/curve repertoire vs the sinker/slider repertoire. Or maybe sinker/change as you say. Although this may overly complicate things.
To my mind, the most interesting part of this analysis was sort of glossed over early. Although the study was focused on the dichotomy between fly balls and ground balls, the first plot shows that line drives are truly king of batted ball values. So, although it was dismissed as inconsequential, the increase in line drive rates on sinkers looms quite large in mind. Even a small increase in line drive rates might make a very large difference, given the dramatically better value of a line drive in play. Perhaps modern players with lower swing paths are more likely to hit a rocket line drive off a non-stellar sinker, whereas players from former eras with flatter swing planes may have been more likely to simply pound the ball into the ground.
This huge run value also makes the FB/LD classification critical. When the data source changes their classification, as we seem to see in these graphs, it heavily changes the observed value of fly balls.
So I’m worried about whether that classification might come out just slightly different between different fastball types. That would mess with everything.
In the future when we can do this all on measured launch angle, that will be nice. In the mean time I wonder if we should actually pool LD+FB together.
This is an excellent point. That’s why I took results for each type each year rather than just for hte overall sample – if 5% of line drives got misclassified as fly balls one year, that would make fly balls more valuable in addition to increasing their incidence. I agree with you that it would be nice to have clearer divisions (which is kind of what xwOBA is doing), but if we want to research historical stuff we’re kind of left with the GB/LD/FB paradigm. It’s 100% worth thinking about though.
Great stuff Ben – thanks! I was wondering why you focused on runs above or below average per swing instead of per outcome. It seems like the greater measure of performance would be from the outcome of the AB by pitch type. According to Baseball Reference, 2019 has the highest K rate of all time at 8.72 per game. The record was set in 2008 at 6.77 Ks per game (seems amazingly low nowadays) and has climbed every year since then. It also has the highest BB rate since 2009 at 3.32 per game. I assume this equates to more pitches/AB overall (more swings and more balls). If you also account for the number of foul balls out of play, the per swing analysis seems like it might not paint a clear picture of which pitch type is more effective, especially if the outcome for a HR or extra base hit is greater by upper-cut hacking on sinkers despite swinging and missing or fouling off into the stands multiple times per AB.
My basic thinking was that if you had a pitch that generated 99 whiffs and a double every hundred pitches, it would probably be pretty good, even if it allowed a very high wOBA on contact. The positive impact to the pitcher of whiffs and fouls is small but real, and not accounting for it probably obscures what is really happening. I’m not confident that the way I handled it is perfect, but I am confident that it needs to be accounted for.
OK, thanks for the response.
Gosh, that second plot (showing GB and FB runs values) really has me wishing the data extended back farther than 2002. As it sits, the increase in FB value almost looks linear over the whole samples and it’s easy to dismiss the increase since 2014 as part of a longer term trend.
So if we put aside what we know, or think we know, about the juiced ball, it would seem very easy to take this data as evidence than the fly ball revolution/HR surge is just an ongoing trend in batter philosophy to sell out for power, strike outs be damned.
I imagine that sinker analysis is tough because it is just a variant of FB. The pitch classification on those is more or less arbitrary.
I would argue that infield defense has never been worse – that would pretty much destroy the effectiveness of sinkers.
Hmm, interesting. Still, despite falling usage rates, the sinker is still thrown often enough that it won’t be going anywhere anytime soon. Heck, the fastest pitch in the game right now Jordan Hicks’s sinker.
Let me add some stuff on statistical significance. Most data are “normally distributed”. That is, most data conform to the normal distribution – the bell shaped curve. That is, a pitcher may throw a fastball at 95, but in actuality, the speed on his fastball is a “mean” of 95. Many leave her/his hand at 93, 94, 96, 97. The central limit theorem states that, with a large enough sample size, the distribution of speeds of fastballs are normally distributed. The variability of the speeds is due to tons of criteria: measurement errors, pitcher effectiveness, air density, temperature, whether the pitcher’s spouse was present, et alia. So how significant is 95 miles per hour? We need to use a t-test to judge if the 95 estimate is significant.
Typically statisticians use significances of 5 or 1%. A significance of 5% means the measurement of the speed is less than 5% due to chance. The only data needed to test for significance are the measurements (94,95,96…) and the number of observations aka sample size.
Let me go the next step. I should also warn readers that these next steps could cure insomnia of 90% of even fangraphs readers. Significant tests of comparison of criteria (sinkers vs. fast balls, etc.) is the most important. For instance, one can state that guy 1 has a higher batting average than guy 2. Say, one has a .310 batting average and the other .306. The only way to determine if that difference is significant and not due to chance is a test of comparison of means., using the t-test. The sample size is key. For example, the results have far more power and are ‘better/stronger’ statistically if the .310 and .306 are drawn from a sample of 1,000 at bats rather than one drawn five at bats.
Spoiler alert: Insider information leads me to warn readers that Ben is considering looking at other data that are bi-normally distributed. Again statistical tests exist to compare bi-normally distributed data sets.
Make sense?
I love this stuff…
It sure is
It sure is working for Dakota Hudson.
Just wanted to say this may have been my favorite article I’ve read on FanGraphs! Great Job!
This is a fantastic article
The sinker tunneling issue makes intuitive sense to me. First off, for a pitcher whose fastball of choice is 4-seam, there’s a little more velocity separation between the FB and his offspeeds, particularly changeups. Secondly, the sinker drops– like those offspeeds. Hitters are taught to look fastball and adjust to offspeed; if the fastball they’re hunting drops, then there’s less adjustment to be made to those offspeeds, again particularly changeups. I’d be interested to see if there’s a correlation between changeup values of sinkerballers and 4seam-specialists like this implies.
This article feels as though it needs an abstract at the beginning.