
The Worst Teams in Baseball History
After the World Series ended and the Nationals emerged victorious, I wrote about how the Astros had put together one of the greatest regular seasons of all time and joined the (perhaps ignominious) list of great teams without a title. In doing so, I created the below graph, which shows team winning percentage and WAR, highlighting some of the greatest teams of all time:
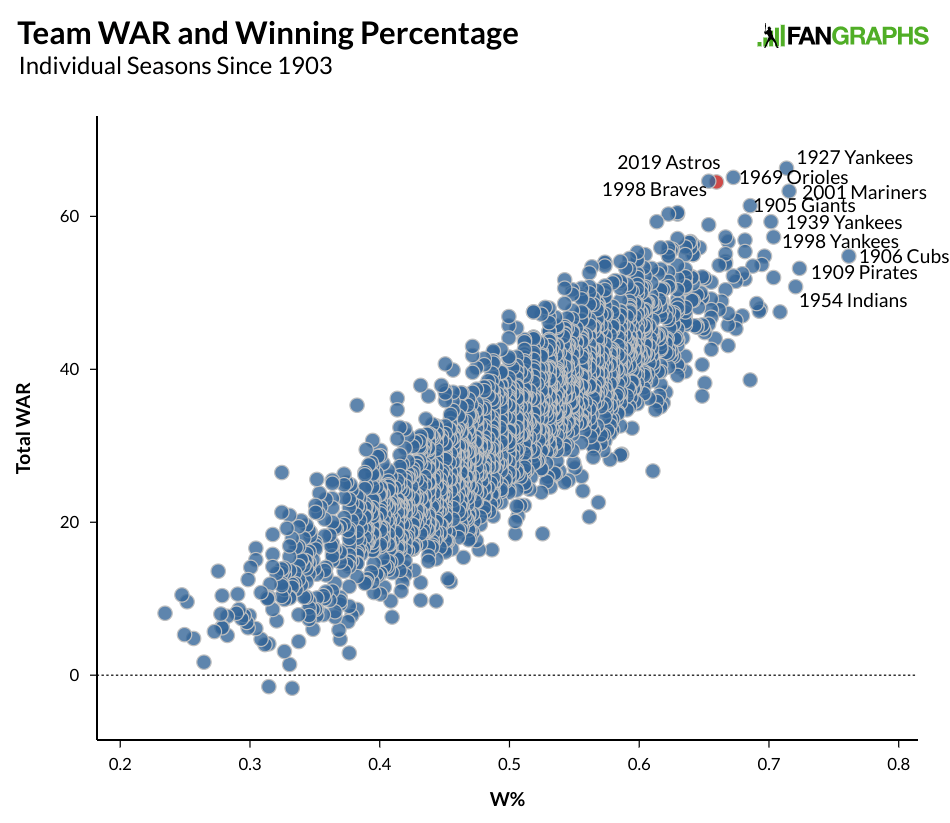
At the time, I didn’t mention the teams at the very bottom-left of the graph. If the teams at the top-right are the greatest, then the teams in the bottom-left are the worst. In trying to find a single number to determine just how good or bad a team was, I created an IQ-like score for both winning percentage and team WAR, where 100 is average and every standard deviation away from the mean was worth 15 points. Then I took the average of the two scores for one final number. For reference, this year’s Astros team ended up at 136.5; more than 90% of all teams from 1903 through this season were between 75 and 125.
Because one big list going back to 1903 might end up with too many teams that some readers might have little interest in, or at least no memory of, let’s start with the worst teams of the last decade:
| Season | Team | W% | W% IQ | Total WAR | WAR IQ | W%/WAR IQ AVG |
|---|---|---|---|---|---|---|
| 2013 | Astros | .315 | 66.1 | 4.1 | 61.6 | 63.9 |
| 2018 | Orioles | .290 | 61.6 | 8.1 | 67.0 | 64.3 |
| 2019 | Tigers | .292 | 61.9 | 8.6 | 67.7 | 64.8 |
| 2010 | Pirates | .352 | 72.9 | 7.8 | 66.6 | 69.8 |
| 2019 | Marlins | .352 | 72.9 | 8.6 | 67.7 | 70.3 |
| 2019 | Orioles | .333 | 69.5 | 11.9 | 72.2 | 70.9 |
| 2012 | Astros | .340 | 70.6 | 15.1 | 76.5 | 73.6 |
| 2011 | Twins | .389 | 79.7 | 12.0 | 72.3 | 76.0 |
| 2018 | Marlins | .391 | 80.1 | 12.6 | 73.2 | 76.6 |
| 2011 | Astros | .346 | 71.8 | 18.9 | 81.7 | 76.7 |
| 2019 | Royals | .364 | 75.2 | 17.0 | 79.1 | 77.1 |
| 2018 | Royals | .358 | 74.0 | 18.2 | 80.8 | 77.4 |
| 2012 | Cubs | .377 | 77.4 | 15.7 | 77.4 | 77.4 |
| 2010 | Mariners | .377 | 77.4 | 17.9 | 80.4 | 78.9 |
| 2018 | Tigers | .395 | 80.8 | 16.3 | 78.2 | 79.5 |
| 2013 | Marlins | .383 | 78.5 | 17.9 | 80.4 | 79.5 |
| 2016 | Reds | .420 | 85.3 | 13.1 | 73.8 | 79.6 |
| 2018 | White Sox | .383 | 78.5 | 18.7 | 81.4 | 80.0 |
The Astros have the honor of putting together both the best and worst regular-season team of the last decade. As we might expect, there’s a decent dose of Orioles, Tigers, and Marlins as well. If we go back a little bit further — to the strike — the list looks like this:
| Season | Team | W% | W% IQ | Total WAR | WAR IQ | W%/WAR IQ AVG |
|---|---|---|---|---|---|---|
| 2003 | Tigers | .265 | 57.1 | 1.7 | 58.3 | 57.7 |
| 2013 | Astros | .315 | 66.1 | 4.1 | 61.6 | 63.9 |
| 2018 | Orioles | .290 | 61.6 | 8.1 | 67.0 | 64.3 |
| 1996 | Tigers | .327 | 68.4 | 3.1 | 60.2 | 64.3 |
| 2019 | Tigers | .292 | 61.9 | 8.6 | 67.7 | 64.8 |
| 2004 | Diamondbacks | .315 | 66.1 | 10.2 | 69.9 | 68.0 |
| 2010 | Pirates | .352 | 72.9 | 7.8 | 66.6 | 69.8 |
| 2005 | Royals | .346 | 71.8 | 8.8 | 68.0 | 69.9 |
| 2019 | Marlins | .352 | 72.9 | 8.6 | 67.7 | 70.3 |
| 2002 | Tigers | .342 | 71.0 | 10.2 | 69.9 | 70.5 |
| 1998 | Marlins | .333 | 69.5 | 11.5 | 71.7 | 70.6 |
| 2019 | Orioles | .333 | 69.5 | 11.9 | 72.2 | 70.9 |
| 2004 | Royals | .358 | 74.0 | 10.0 | 69.6 | 71.8 |
| 2002 | Devil Rays | .342 | 71.0 | 14.3 | 75.5 | 73.2 |
| 2012 | Astros | .340 | 70.6 | 15.1 | 76.5 | 73.6 |
| 2002 | Brewers | .346 | 71.8 | 14.7 | 76.0 | 73.9 |
| 2011 | Twins | .389 | 79.7 | 12.0 | 72.3 | 76.0 |
| 2001 | Devil Rays | .383 | 78.5 | 12.9 | 73.6 | 76.1 |
| 2018 | Marlins | .391 | 80.1 | 12.6 | 73.2 | 76.6 |
| 2011 | Astros | .346 | 71.8 | 18.9 | 81.7 | 76.7 |
| 2008 | Nationals | .366 | 75.6 | 16.4 | 78.3 | 76.9 |
| 2019 | Royals | .364 | 75.2 | 17.0 | 79.1 | 77.1 |
| 2002 | Royals | .383 | 78.5 | 14.7 | 76.0 | 77.3 |
| 2018 | Royals | .358 | 74.0 | 18.2 | 80.8 | 77.4 |
| 2012 | Cubs | .377 | 77.4 | 15.7 | 77.4 | 77.4 |
| 1999 | Twins | .394 | 80.6 | 13.5 | 74.4 | 77.5 |
| 1995 | Tigers | .417 | 84.8 | 11.0 | 71.0 | 77.9 |
| 2001 | Pirates | .383 | 78.5 | 15.7 | 77.4 | 78.0 |
Looking at this list, you’d never know Detroit appeared in a couple World Series and were generally competitive for close to a decade. They’ve put together three of the five worst teams over the last 25 seasons. That 2003 Tigers team is particularly awful: 14 players on that squad had more than 100 plate appearances and only Carlos Pena and Dmitri Young were better than average offensively, though defensive limitations meant that Young only put up a 1.9 WAR while Pena came in at 0.6 on the year. Young was the only position player to exceed 1 WAR that year while Matt Walbeck and Ramon Santiago put up less than -1 WAR. On the pitching side, Nate Cornejo and Jeremy Bonderman were the only pitchers with at least 1.0 WAR on the season and neither broke two wins. There wasn’t a single above-average player on the entire roster, and they went 43-119 as a result.
As to whether the 2003 Tigers were the worst team of all time, let’s go back to 1947 and see if anybody can take the top (bottom?) spot:
| Season | Team | W% | W% IQ | Total WAR | WAR IQ | W%/WAR IQ AVG |
|---|---|---|---|---|---|---|
| 2003 | Tigers | .265 | 57.1 | 1.7 | 58.3 | 57.7 |
| 1962 | Mets | .250 | 54.3 | 5.3 | 63.2 | 58.7 |
| 1963 | Mets | .315 | 66.1 | -1.5 | 54.0 | 60.1 |
| 1952 | Pirates | .273 | 58.4 | 5.7 | 63.8 | 61.1 |
| 1979 | Athletics | .333 | 69.5 | -1.7 | 53.7 | 61.6 |
| 1954 | Athletics | .331 | 69.1 | 1.4 | 57.9 | 63.5 |
| 1965 | Mets | .309 | 65.0 | 4.7 | 62.4 | 63.7 |
| 2013 | Astros | .315 | 66.1 | 4.1 | 61.6 | 63.9 |
| 2018 | Orioles | .290 | 61.6 | 8.1 | 67.0 | 64.3 |
| 1996 | Tigers | .327 | 68.4 | 3.1 | 60.2 | 64.3 |
| 2019 | Tigers | .292 | 61.9 | 8.6 | 67.7 | 64.8 |
| 1951 | Browns | .338 | 70.3 | 4.4 | 62.0 | 66.2 |
| 1969 | Padres | .321 | 67.3 | 7.1 | 65.7 | 66.5 |
| 2004 | Diamondbacks | .315 | 66.1 | 10.2 | 69.9 | 68.0 |
| 1956 | Athletics | .338 | 70.3 | 7.9 | 66.8 | 68.5 |
| 1977 | Braves | .377 | 77.4 | 2.9 | 60 | 68.7 |
| 1979 | Blue Jays | .327 | 68.4 | 9.9 | 69.5 | 68.9 |
| 1953 | Pirates | .325 | 67.9 | 10.3 | 70.0 | 69.0 |
| 1963 | Senators | .346 | 71.8 | 7.8 | 66.6 | 69.2 |
| 1974 | Padres | .370 | 76.3 | 4.7 | 62.4 | 69.3 |
| 2010 | Pirates | .352 | 72.9 | 7.8 | 66.6 | 69.8 |
| 2005 | Royals | .346 | 71.8 | 8.8 | 68.0 | 69.9 |
The Mets didn’t get off to a great start when baseball expanded and wanted to replace the two departing New York franchises as the Dodgers and Giants moved out west. In their first four seasons, they averaged a 49-113 record and 49 games out of first place. In the three seasons following the initial four, the team finished in last or second-to-last place every year. Then in 1969, they won the World Series as the “Miracle Mets,” a very appropriate nickname for the group. That inaugural season in 1962 was the worst of the bunch, with the team finishing 40-120, but a strong season from pitcher Al Jackson and decent seasons from Frank Thomas and Richie Ashburn meant the team was a little more talented than that 2003 Detroit Tigers club. What if we go all the way back to 1903, the year of the first World Series?
| Season | Team | W% | W% IQ | Total WAR | WAR IQ | W%/WAR IQ AVG |
|---|---|---|---|---|---|---|
| 2003 | Tigers | .265 | 57.1 | 1.7 | 58.3 | 57.7 |
| 1962 | Mets | .250 | 54.3 | 5.3 | 63.2 | 58.7 |
| 1919 | Athletics | .257 | 55.6 | 4.8 | 62.5 | 59.1 |
| 1916 | Athletics | .235 | 51.6 | 8.1 | 67.0 | 59.3 |
| 1963 | Mets | .315 | 66.1 | -1.5 | 54.0 | 60.1 |
| 1952 | Pirates | .273 | 58.4 | 5.7 | 63.8 | 61.1 |
| 1979 | Athletics | .333 | 69.5 | -1.7 | 53.7 | 61.6 |
| 1915 | Athletics | .283 | 60.3 | 5.2 | 63.1 | 61.7 |
| 1904 | Senators | .252 | 54.6 | 9.6 | 69.1 | 61.8 |
| 1939 | Browns | .279 | 59.6 | 6.2 | 64.5 | 62.0 |
| 1935 | Braves | .248 | 54.0 | 10.5 | 70.3 | 62.1 |
| 1932 | Red Sox | .279 | 59.6 | 6.3 | 64.6 | 62.1 |
| 1942 | Phillies | .278 | 59.4 | 8.0 | 66.9 | 63.2 |
| 1928 | Phillies | .283 | 60.3 | 7.7 | 66.5 | 63.4 |
| 1954 | Athletics | .331 | 69.1 | 1.4 | 57.9 | 63.5 |
| 1920 | Athletics | .312 | 65.6 | 4.0 | 61.5 | 63.5 |
| 1965 | Mets | .309 | 65.0 | 4.7 | 62.4 | 63.7 |
| 1945 | Phillies | .299 | 63.2 | 6.2 | 64.5 | 63.8 |
| 2013 | Astros | .315 | 66.1 | 4.1 | 61.6 | 63.9 |
| 1909 | Doves | .294 | 62.3 | 7.4 | 66.1 | 64.2 |
| 1939 | Phillies | .298 | 63.1 | 6.9 | 65.4 | 64.2 |
| 1910 | Browns | .305 | 64.4 | 6.1 | 64.3 | 64.3 |
| 2018 | Orioles | .290 | 61.6 | 8.1 | 67.0 | 64.3 |
| 1996 | Tigers | .327 | 68.4 | 3.1 | 60.2 | 64.3 |
| 1911 | Browns | .296 | 62.7 | 7.8 | 66.6 | 64.7 |
| 2019 | Tigers | .292 | 61.9 | 8.6 | 67.7 | 64.8 |
| 1941 | Phillies | .279 | 59.6 | 10.4 | 70.2 | 64.9 |
| 1938 | Phillies | .300 | 63.4 | 7.8 | 66.6 | 65.0 |
| 1911 | Rustlers | .291 | 61.8 | 10.6 | 70.4 | 66.1 |
| 1951 | Browns | .338 | 70.3 | 4.4 | 62.0 | 66.2 |
| 1969 | Padres | .321 | 67.3 | 7.1 | 65.7 | 66.5 |
| 1909 | Senators | .276 | 59.1 | 13.6 | 74.5 | 66.8 |
I don’t take any great joy in telling you that the 2003 Tigers are the worst team of all time. I did think it might be interesting though, so there it is. Because the work was basically already done, here are the worst teams in each franchise’s history using the current iteration of the franchise with the exception of the Devil Rays, which count as the Rays, the Florida and Miami Marlins being the same, and all the Angels team being included together:
| Season | Team | W% | W% IQ | Total WAR | WAR IQ | W%/WAR IQ AVG |
|---|---|---|---|---|---|---|
| 1968 | Angels | .414 | 84.2 | 18.4 | 81.0 | 82.6 |
| 2013 | Astros | .315 | 66.1 | 4.1 | 61.6 | 63.9 |
| 1979 | Athletics | .333 | 69.5 | -1.7 | 53.7 | 61.6 |
| 1979 | Blue Jays | .327 | 68.4 | 9.9 | 69.5 | 68.9 |
| 1977 | Braves | .377 | 77.4 | 2.9 | 60.0 | 68.7 |
| 2002 | Brewers | .346 | 71.8 | 14.7 | 76.0 | 73.9 |
| 1903 | Cardinals | .314 | 66.0 | 10.1 | 69.8 | 67.9 |
| 1962 | Cubs | .364 | 75.2 | 17.2 | 79.4 | 77.3 |
| 2004 | Diamondbacks | .315 | 66.1 | 10.2 | 69.9 | 68.0 |
| 1992 | Dodgers | .389 | 79.7 | 21.9 | 85.8 | 82.7 |
| 1985 | Giants | .383 | 78.5 | 22.1 | 86.1 | 82.3 |
| 1971 | Indians | .370 | 76.3 | 9.3 | 68.7 | 72.5 |
| 1978 | Mariners | .350 | 72.6 | 13.9 | 74.9 | 73.7 |
| 2019 | Marlins | .352 | 72.9 | 8.6 | 67.7 | 70.3 |
| 1962 | Mets | .250 | 54.3 | 5.3 | 63.2 | 58.7 |
| 2008 | Nationals | .366 | 75.6 | 16.4 | 78.3 | 76.9 |
| 2018 | Orioles | .290 | 61.6 | 8.1 | 67.0 | 64.3 |
| 1969 | Padres | .321 | 67.3 | 7.1 | 65.7 | 66.5 |
| 1942 | Phillies | .278 | 59.4 | 8.0 | 66.9 | 63.2 |
| 1952 | Pirates | .273 | 58.4 | 5.7 | 63.8 | 61.1 |
| 1972 | Rangers | .351 | 72.7 | 8.6 | 67.7 | 70.2 |
| 2002 | Rays | .342 | 71.0 | 14.3 | 75.5 | 73.2 |
| 1932 | Red Sox | .279 | 59.6 | 6.3 | 64.6 | 62.1 |
| 1934 | Reds | .344 | 71.5 | 15.9 | 77.6 | 74.6 |
| 1999 | Rockies | .444 | 89.8 | 9.7 | 69.2 | 79.5 |
| 2005 | Royals | .346 | 71.8 | 8.8 | 68 | 69.9 |
| 2003 | Tigers | .265 | 57.1 | 1.7 | 58.3 | 57.7 |
| 2011 | Twins | .389 | 79.7 | 12.0 | 72.3 | 76.0 |
| 1932 | White Sox | .325 | 67.9 | 11.7 | 71.9 | 69.9 |
| 1913 | Yankees | .377 | 77.6 | 15.2 | 76.7 | 77.1 |
The Dodgers, Giants, and Angels have some of the best worst teams. I’d also note that the Cardinals haven’t gone below a score of 90 in a non-strike season since 1978 when they had an 86.7 score. Indeed, they’ve only been below 90 three times in the last 100 seasons. Perhaps even more impressive, the Yankees have only gone below 100 four times in the last 50 seasons, with all four coming in succession from 1989-1992. In the last 100 years, they’ve only been below 100 a total of 10 times, with a run from 1965-1969 accounting for half of those seasons (1925 was the only other year not previously mentioned). I was going to end on a positive note and say that using the same method, the best two regular-season teams of the last decade based on average yearly score have been the Dodgers and Yankees, but I can’t help but also note that neither team has won the World Series in that time.
Craig Edwards can be found on twitter @craigjedwards.
As soon as I saw the title, I was expecting the answer is the Astros… very disappointed
1899 Cleveland Spiders was my expectation, he started in 1903 to avoid them though.
Or the 1883 Philadelphia Quakers (17-81, .173) or the 1890 Pittsburgh squad in the National League (23-113, .169), or the 1889 Louisville Colonels of the American Association (27-111, .196).
I’d be curious to see what each franchise overall average is.
And that 1979 A’s team should get honorable mention as the worst simply by being almost two full wins below replacement.
When your team is below replacement, replace! The Billy Ball teams had a winning record the next year and were in the playoffs in 1981.
The Yankees have to have the best overall average, no question. I’d guess the Cardinals are second and at the top of the NL, although the Dodgers or Giants might beat them out.
As for the worst, I’ll say either the Rockies or the Mariners, who both share a dismal .471 winning percentage in franchise history. The Browns/Orioles are also a contender at .474. There’s also the Phillies at .472, but that’s dragged down by some very bad teams before 1903.
If this were 10 years ago, I’d definitely say the Expos/Nationals were the worst.
It’s going to take a while for me to forget those Astros teams. They were an utter embarrassment.
Does the current Astros not help you forget the awfil teams? Or do they also belong in the trashcan?
The Astros’ trash can is the metaphor of the month! But no, not really (although I suppose it is possible I will forget the trash can itself).
The worst team is.really obviously the 1962-1965 Mets. Landing 3 teams near the bottom of that list within 4 years.means they sustained the badness for so much longer than those other teams make them worse than the others.
I know that the team that eventually became the Astros also debuted around the same time and didn’t have that embarrassing run, but I do think that they deserve a bit of a break for being an expansion team.
What’s kind of interesting isn’t the truly horrible teams who got that way because they simply stunk (poor rosters, off years, bad luck, injuries), but the one who worked at stinking–like the 2013 Astros or the ’79 Athletics. Also interesting that ten of the lousiest teams occurred from 2000 to now.
I would mostly agree with this, but also: The 2018 Orioles. Sheesh. The exception to the rule.
Does “Nationals” also include the Expos?
No. Just since the move. The 1969 Expos were worse than any Nationals team and didn’t miss the post-1947 list by much.
What about teams that just had a name change while staying in the same city (aside from your 3 exceptions)? For example, there are a couple of Yankee teams that were probably even worse than their 1913 squad but apparently didn’t qualify just because they were known as the Highlanders back then. I don’t think it’s fair to discount teams like that.
Thank you for this, and especially for reminding me of Nate Cornejo, whom I had on a fantasy team way back when. In 2003, he had the lowest K % of any starting pitcher I can remember in my lifetime: 5.5%. He struck out 46 in 194 innings (and walked 58).
You have to go back to 1953 before you find someone with a lower K% as a starter: Spec Shea on the Senators.
In 1913 the Athletics won the World Series (defeating the New York Giants).
But then the 1915, 1916, and 1919 A’s are 3 of the worst 8 teams of all time (add in 1920 to get 4 of the worst 16 teams).
That’s quite the decline.
It was a product of the Federal League driving up salaries to the point that Connie Mack could not afford them, which was a problem because Mr. Mack was also a bit cheap. These are the significant players the Athletics lost from the pennant winning 1914 team, though some of the transactions were not until mid-1915:
Eddie Collins (9.1 bWAR in 1914): sold to the White Sox
Home Run Baker (7.4 bWAR in 1914): held out entire year because Eddie Collins got a multi-year contract and he didn’t, sold to Yankees after the season; the only reason Collins got a multi-year contract was to keep him from jumping to the FL
Jack Barry (4.3): sold to Boston
Chief Bender (3.6): jumped to the Baltimore Feds
Eddie Murphy (2.5): sold to White Sox
Bob Shawkey (2.2): sold to Yankees
Eddie Plank (2.0): jumped to the St. Louis Feds
Herb Pennock (1.7): after having a terrible season, claimed by Boston off waivers
It’s a bit hard to recover from shedding 33 WAR and 5 Hall of Famers.
Seeing those 60s Mets….
(NSFW Language):
https://sports.theonion.com/in-my-day-ballplayers-were-for-shit-1819583715
The 1962 Mets and Colts got screwed by the particular set of rules for that expansion draft and led to dreadful teams. Enough that those rules were never used again. Baseball needs to expand again just to see an expansion draft with current knowledge- it would be riveting which is sort of embarrassing to admit.
The ’93 and ’98 expansion drafts (well, I guess they were technically in ’92 and ’97) went pretty well judging by how quickly the Marlins and Diamondbacks won the World Series, and even the Rockies made the playoffs in just their 3rd year.
I clicked this article as Tigers fan in a vain attempt to find a team worse than 2003…I knew in my heart, now I know in my brain.
You can’t have a discussion about the worst team of all time without talking about the 1899 Cleveland Spiders. They posted the worst season in MLB history, 20-134.
It’s such a fun story. They were a good team the year before, but the owners also purchased the St. Louis Browns and decided to transfer all their star players like Cy Young to the team in St. Louis since they thought they’d make more money. So this team ended up just full of their trash.
It’s also because of this that the Spiders were one of 4 NL teams to get contracted after that season, while the Browns/Perfectos/Cardinals survived the cuts with that one good year only to mostly stink for the next 20 years until Branch Rickey invented the farm system.
Any idea where we could find the list with every team ranked.
Hmm, I’m surprised the 1990 Cardinals didn’t fall below 90, seeing as that’s the only time in the last century that the Cards have finished in the cellar of their league/division.
The 1985 SF Giants tried scheduling more day games to make up for the fact that Candlestick was a terrible place to be at night. I remember buying a “tan ticket” value pack that was basically inexpensive vouchers for weekday day games (I was 15).
Their slogan that year was ” “Real Grass, Real Sunshine, Real Baseball,”, which quickly gained the add-on “two out of three ain’t bad”
Not that Oracle is much warmer most of the time but my God, Candlestick was cold.
For me, the most interesting thing to learn here is that for each franchise’s worst year, only two of them were their expansion years (Mets and Padres). That means that MLB expansion rules are more or less fair. Also, the Twins’ worst year came the year after a division championship! Yikes!
The 2004 Diamondbacks were one Randy Johnson (9.6 FWAR) away from being the worst team of all time.
Love that you went back to explore this graph further. I often see these sorts of things and have all sorts of questions like that.
Next: how about a look at some of the major outliers from the graph? I’m very curious who the two teams with the roughly identical 37-38 WAR but vastly different results are … one with a nearly .700 record and the other below .400
The 2019 Red Sox are not on this list. Shook!