They Don’t Make Barrels Like They Used To
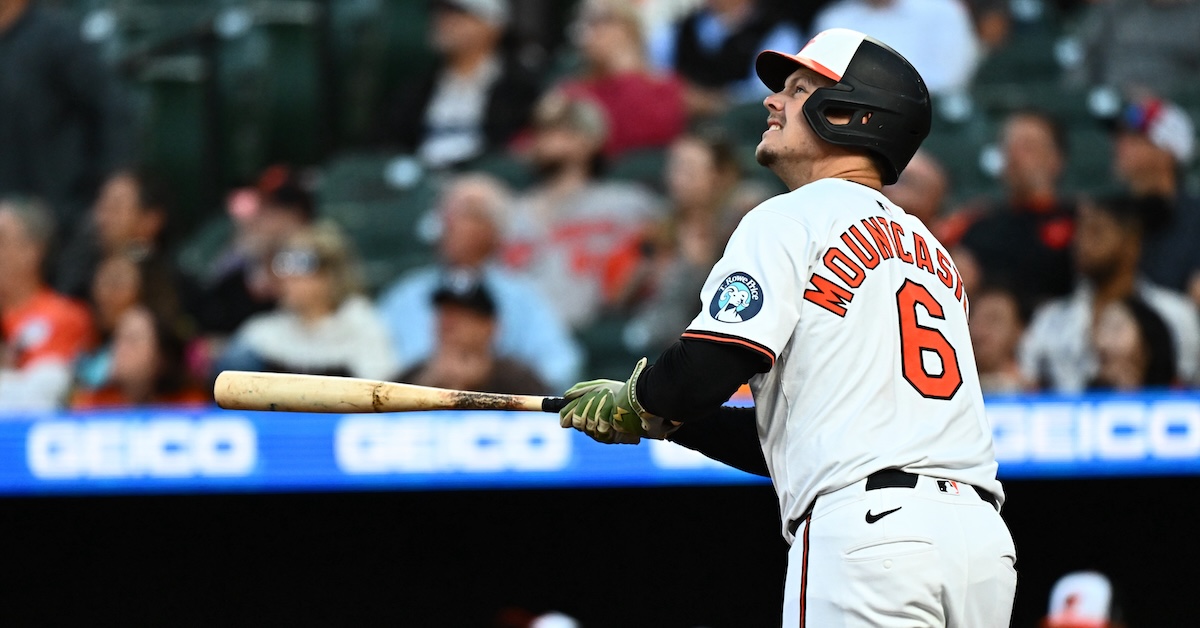
Here’s a weird chart:
If you’re like me, you’re struggling to make sense of it. The value of a barrel? But aren’t barrels a measure of value themselves? That’s like asking how many dollars a ten dollar bill is worth, or how you’d rate The Lion King on a scale of one to The Lion King. But that’s not actually how it works. Barrels are defined based on exit velocity and launch angle pairs that, according to the dataset MLB used in their creation, were extremely likely to result in extra-base hits. Those cutoffs have remained the same. The results on barrels haven’t.
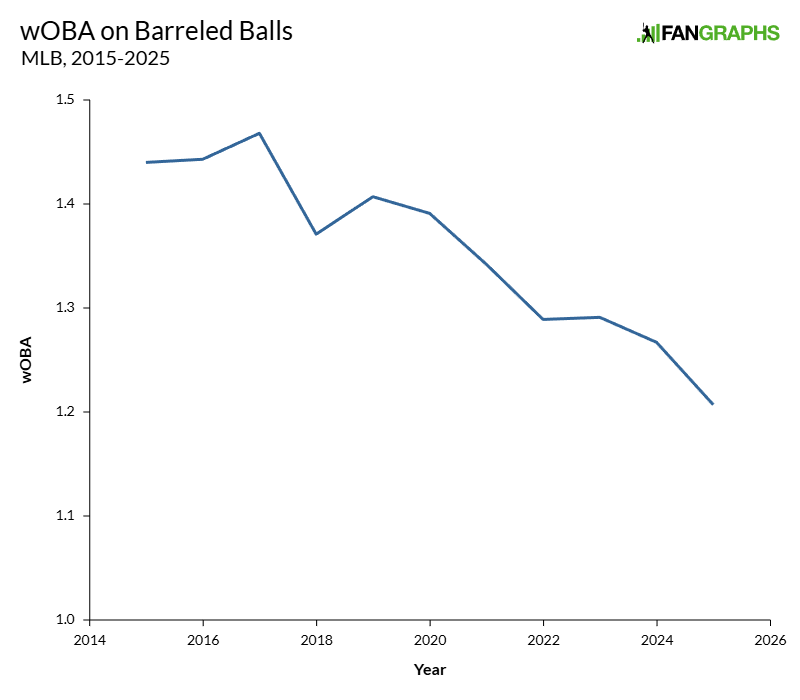
What gives? Well, some of it is the ball, of course. I’m not breaking new news in the long-running ball aerodynamics debate; you can read some good recent entries into tracking drag coefficients and the like here and here. Indeed, if you’re measuring barrels that way, you can see a pretty straightforward decline. Here are home runs per barrel over the years:
Fewer balls are leaving the yard. That’s definitely true. But that’s not what I’m hunting for. Let’s exclude all the home runs from barrels and focus on the balls that stayed in the yard. Here’s wOBA and xwOBA on non-homer barrels, 2015 to present:
| Year | wOBA | xwOBA |
|---|---|---|
| 2015 | .656 | 1.206 |
| 2016 | .678 | 1.202 |
| 2017 | .656 | 1.218 |
| 2018 | .610 | 1.140 |
| 2019 | .632 | 1.154 |
| 2020 | .639 | 1.109 |
| 2021 | .612 | 1.044 |
| 2022 | .582 | 1.024 |
| 2023 | .573 | 1.019 |
| 2024 | .550 | 1.022 |
| 2025 | .508 | .977 |
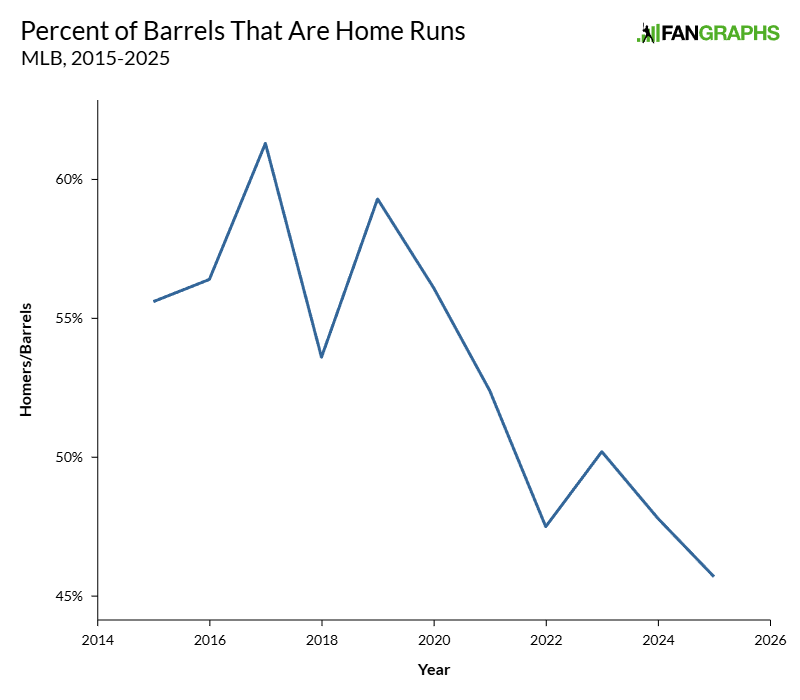
Or how about this one, barrel BABIP:
Or how about this overly specific one, BABIP on barrels hit between 300 and 400 feet to center:
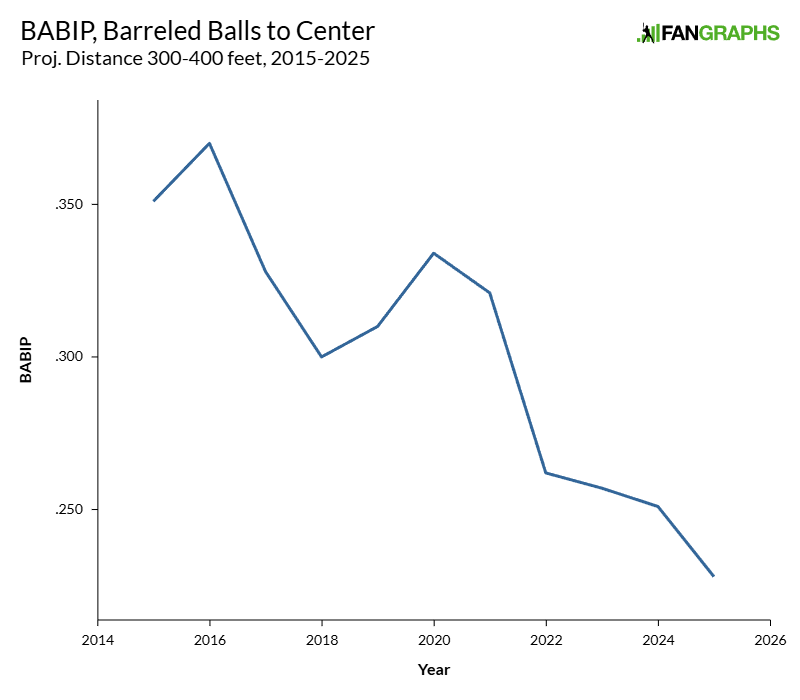
All of these graphs are pointing towards the same conclusion. And even without thinking too hard about the aerodynamics of the ball, you can take a pretty good guess as to what’s going on here: Outfielders are catching too dang many barrels these days.
In a common refrain for sabermetricians, Rob Arthur has already looked into this. All the way back in 2021, Rob dug into how balls in the outfield were falling less often. Better defensive positioning? Some downstream effect of the universal DH? Who knows. But outfielders were catching more baseballs than ever, and that trend has only increased in the years since. Russell Carleton confirmed the finding in 2024. Like Arthur, he didn’t come to a conclusion about why outfield defense was improving, but the fact of the matter is that outfielders are more effective than they were a decade ago.
It’s worth mentioning that you can split this trend into two. Softer-hit aerial contact is turning into hits about as often as ever. Hard-hit balls, on the other hand? They’re getting turned into outs more frequently. Well, the fly balls are, at least. Line drives seem to be pretty hard to catch:
| Year | FB | LD |
|---|---|---|
| 2015 | .150 | .661 |
| 2016 | .152 | .676 |
| 2017 | .158 | .672 |
| 2018 | .149 | .658 |
| 2019 | .153 | .668 |
| 2020 | .117 | .662 |
| 2021 | .153 | .663 |
| 2022 | .157 | .653 |
| 2023 | .142 | .668 |
| 2024 | .139 | .650 |
| 2025 | .130 | .647 |
I think that a major reason for this change is improved defensive positioning. The average center fielder starts 10 feet further back than they did in 2015. Left fielders and right fielders have backed up too. That had all happened by 2019, but outfielders have presumably gotten more accustomed to starting deep in the intervening years, re-learning routes and refining jumps. The natural counter to the offense realizing that extra-base hits are where the runs are is to start guarding against extra-base hits more often.
Remember that chart of home runs per barrel from up above? With all of those well-struck batted balls not leaving the yard, you’d expect the rate of doubles per barrel to increase. But instead, it’s static, checking in at 17.8% in 2025 as compared to 18.2% in 2015, and 18.2% for the Statcast era as a whole. We’ve never had a lower rate of triples per barrel, either, though batters only hit 197 barreled triples in 2025 as compared to 8,000-ish doubles and 5,000-ish homers, so triples are obviously less meaningful in this equation. On the other hand, singles per barrel are generally increasing – an effect of the outfielders playing back, presumably.
What does all of this mean for us stat-following nerds? Basically, they don’t make barrels like they used to. Here’s a mathematical example. Imagine a slugger from 2016. Our hypothetical hitter strikes out 23% of the time, walks 10% of the time, and barrels up 12.5% of his batted balls, a top-20 rate in baseball. Give him exactly average results on contact for his barrels and his non-barrels, and that works out to a .363 wOBA, a number that ranked 33rd in baseball that year.
Next, imagine a hitter with the exact same results in 2025. He strikes out 23% of the time, walks 10% of the time, and barrels up 12.5% of his batted balls. Barrels becoming less valuable has made our hitter meaningfully worse; with league average results on his barrels and non-barrels, he now posts a .337 wOBA. That would have been 57th in baseball last year; in addition to being worse in the absolute sense given that offense was lower in 2025, it’s worse on a relative basis too. In other words, a guy who hits a ton of barrels just isn’t as valuable as he used to be.
Now, are there mitigating circumstances here? Of course there are. Batters are barreling the ball up more frequently now, for one thing. Hitters smashed nearly 3,000 more barrels in 2025 than they did in 2017, the year when those colossal drives were most valuable. That 12.5% barrels-per-batted-ball mark that was one of the best in the sport in 2016? It would have been 55th among qualifying hitters in 2025. Loud contact is happening a lot more frequently now than it was then, even if it’s less valuable per event.
There’s also the problem of Goodhart’s Law. If you hadn’t heard of that one, here it is in a sentence: “When a measure becomes a target, it ceases to become a good measure.” In other words, if a group of people starts targeting some specific variable that’s associated with success, that variable’s association with success will decrease. Tell hitters that barrels get them paid, and they might start to change their behavior in a way that produces less valuable barrels, squared up to center field or in other ways that are easier to produce but less likely to land safely.
Do hitters know that they should be targeting barrels? Most definitely. Are they targeting a Statcast-defined barrel at the expense of just generally hitting the ball hard? I have absolutely no idea. But it’s unquestionably true that if you tell players “start hitting more barrels, and by the way, here’s a leaderboard for barrels,” some of their barrel-increasing behavior will probably be counter-productive in unexpected ways.
So are defenders better? Are hitters worse? Are they fooling themselves? Is the ball just dead? It’s definitely some of those things. But regardless of what’s causing it, if you’ve been in on Statcast data since the start and have developed a mental rule for how productive a hitter with a barrel rate of X is, you need to update your priors. Slug is still in the air. There’s just a little less of it than there used to be.
Ben is a writer at FanGraphs. He can be found on Bluesky @benclemens.
Ben, does this mean that the xWOBACON stat is just totally flawed and unreliable at this point?
WO BACON is always a reliable metric, especially in the presence of bacon.
Not at all. xwOBA has pros and cons that are more lengthy than I’m going to get into here, but it’s recentered every year based on that year’s data. For example, in 2015, batters produced a .361 wOBA and .357 xwOBA on batted balls. In 2025, they managed a .364 wOBA and .369 xwOBA. If xwOBA weren’t being re-defined every year, that would not happen.
I mean, what are you using the stat for? It doesn’t really do anything.