Toppling Ted: The 60-Game Season and the .400 Batting Average
One of the ways that the baseball of yesteryear was different from baseball today was the importance of batting average. With a pitching philosophy that envisioned lots and lots of balls being hit into play and no gauntlet of modern relief pitchers to face, far more at-bats ended with a ball being handled by a defensive player. In 2019, 63% of plate appearances ended with a ball being hit into play. In 1919, that figure was 81%. With half as many fieldable balls, it’s hardly a shock that league batting averages have declined. The effect would be even larger, too, but batting average on balls hit into play was higher in 2019 (.298) than in 1919 (.282).
Hitting .400 was never an easy feat, but it wasn’t some wild, once-in-a-lifetime occurrence when it did happen. The .400 mark has been eclipsed 34 times in major league history, give or take (the number varies depending on just what you consider a major league team in the wild world of 1870s baseball). Ted Williams hit .406 in 1941 and that was it, the last time a major leaguer hit .400 over a season. It’s more than just the lower league batting averages. Baseball’s .252 batting average in 2019 was still higher than in 17 seasons before 1941. Baseball has trended in a more competitive direction and as a league becomes more competitive, you generally expect the differences between players to shrink. That’s true for batting average, too. Just look at the simplest measure of dispersion, standard deviation:
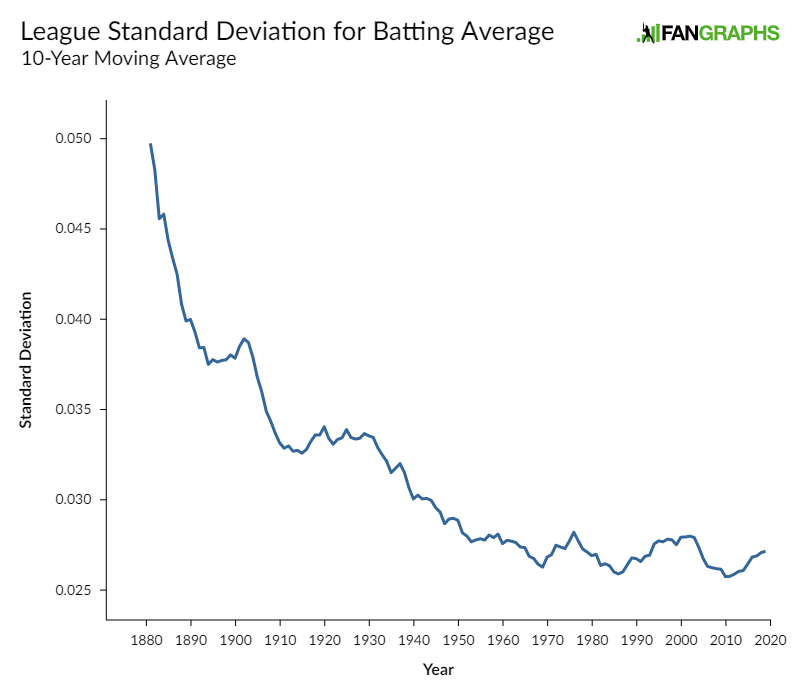
The standard deviation has gotten smaller as time has progressed. Using this simple method, Ted Williams’s .406 in 1941 was 4.46 standard deviations better than the mean batting average of .262 (z-score). A z-score of 4.46 in 2019 only represents a .370 batting average. Nobody’s hit that mark recently, either, but .370 certainly doesn’t feel like anywhere near the same hurdle.
Since it’s the obvious next question, here are the best batting averages by Z-Score. Again, there are more robust ways to look at this, but we’re scrawling on envelope-backs, not landing astronauts on the moon:
| Season | Name | Batting Average | Z-Score |
|---|---|---|---|
| 1977 | Rod Carew | .388 | 4.86 |
| 1980 | George Brett | .390 | 4.75 |
| 1941 | Ted Williams | .406 | 4.46 |
| 1887 | Tip O’Neill | .435 | 4.22 |
| 1909 | Ty Cobb | .377 | 4.22 |
| 1910 | Nap Lajoie | .384 | 4.20 |
| 1985 | Wade Boggs | .368 | 4.18 |
| 1910 | Ty Cobb | .383 | 4.17 |
| 1999 | Larry Walker | .379 | 4.16 |
| 1988 | Wade Boggs | .366 | 4.16 |
| 1913 | Ty Cobb | .390 | 4.13 |
| 1939 | Joe DiMaggio | .381 | 4.12 |
| 1957 | Ted Williams | .388 | 4.12 |
| 1911 | Ty Cobb | .420 | 4.12 |
| 1924 | Rogers Hornsby | .424 | 4.11 |
| 1974 | Rod Carew | .364 | 4.06 |
| 2004 | Ichiro Suzuki | .372 | 4.05 |
| 2002 | Barry Bonds | .370 | 4.05 |
| 1904 | Nap Lajoie | .376 | 4.03 |
| 1916 | Tris Speaker | .386 | 4.03 |
| 2009 | Joe Mauer | .365 | 4.01 |
| 1987 | Tony Gwynn | .370 | 4.00 |
| 1971 | Joe Torre | .363 | 3.99 |
| 1917 | Ty Cobb | .383 | 3.98 |
| 1970 | Rico Carty | .366 | 3.96 |
Ted still looks great, as he should. But it does change our batting champions around a bit.
“But Dan, I want to see a .400 hitter, not a roughly equivalent, .370 hitter!”
We do like whole numbers, even if we know better. I’m 42 and describe myself as in my 40s, not my “37-to-47s.” Helen of Troy was described as having a face that launched a thousand ships, not precisely 843 or 1153 or 966. My colleague Craig Edwards talked about .400 hitters three weeks ago. He calculated the odds of a .400 hitter based on a simple binomial distribution, meaning the likelihood of a particular hitter hitting .400 over 200 BA given an underlying “known” batting average.
From this methodology, our odds of a .400 hitter aren’t very good. Using the ZiPS BA projections for the 183 players with at least 186 projected plate appearances on our depth charts, there’s only a 2.8% chance we get a .400 hitter, even in a shortened 60-game season. Luis Arraez fares best, with a 0.47% of getting at least 75 hits in 187 at-bats, while Daniel Murphy has a 0.18% chance to get 72 hits in 180 at-bats, and so on.
Luckily, as Craig notes me noting — if Craig now quotes this piece, we may have an Inception situation — the binomial distribution is a big fat liar. What gives us better odds of seeing a .400 hitter than this is that we don’t actually know the underlying batting averages of a player. The projected batting average is simply a midpoint of our expectations, not any kind of “true” probability. And it’s that uncertainty that makes awesome things, like Nolan Ryan’s no-hitters and Joe DiMaggio’s hit streak, more plausible.
And really, who doesn’t absolutely love math?
Imagine that you’ve spent a summer at probability camp. But tomorrow is the big coin-flip betting competition against those spoiled brats at that camp for rich kids on the other side of the lake. You’ve got 100 quarters and you know how to bet on them because you know how the probability works!
Now, for the nitpicky here, even a coin flip isn’t truly random — it’s just extremely difficult for humans to ascertain the variable that result in a heads or tails result. That we have to deal with pseudo-randomness has consequences in fields such as cryptography, leading people to use certain natural sources of randomness that are harder to predict, such as nuclear decay or atmospheric noise.
Knowing there’s a 50% chance of each coin coming up heads, you have a good idea the distribution of heads results likely after selecting and flipping coins 100 times:
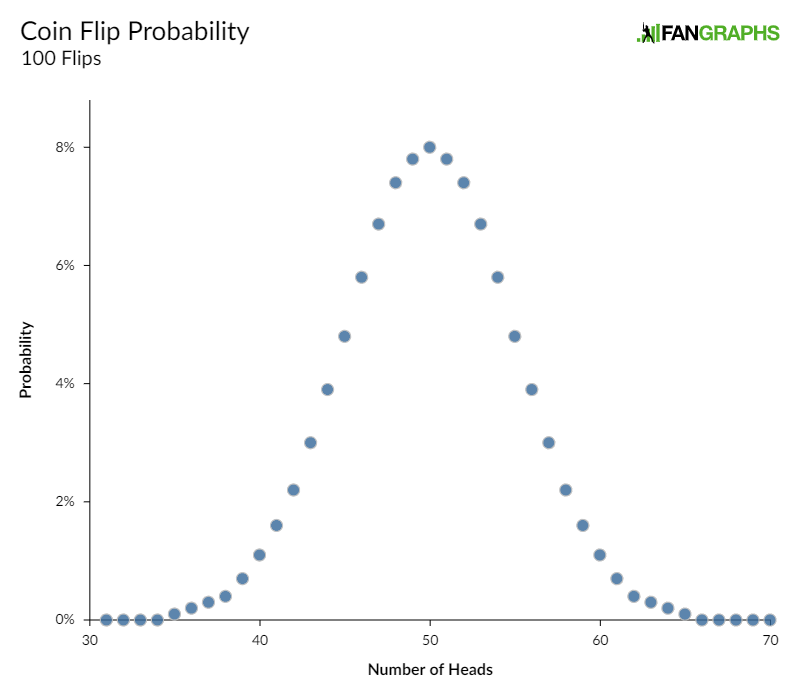
But, what if you don’t actually know that the coins are 50/50? You have an arch nemesis, let’s just call him “Carson.” Carson’s replaced 25 of your coins with coins that are weighted in such a way that they’ll only come up 40% heads! And another kid, let’s say his name is “Jeff,” replaced another 25 of your coins with coins that will come up 60% heads! You’d still expect the mean result to be 50 heads, 50 tails, but the distribution changes quite a bit because of this uncertainty:
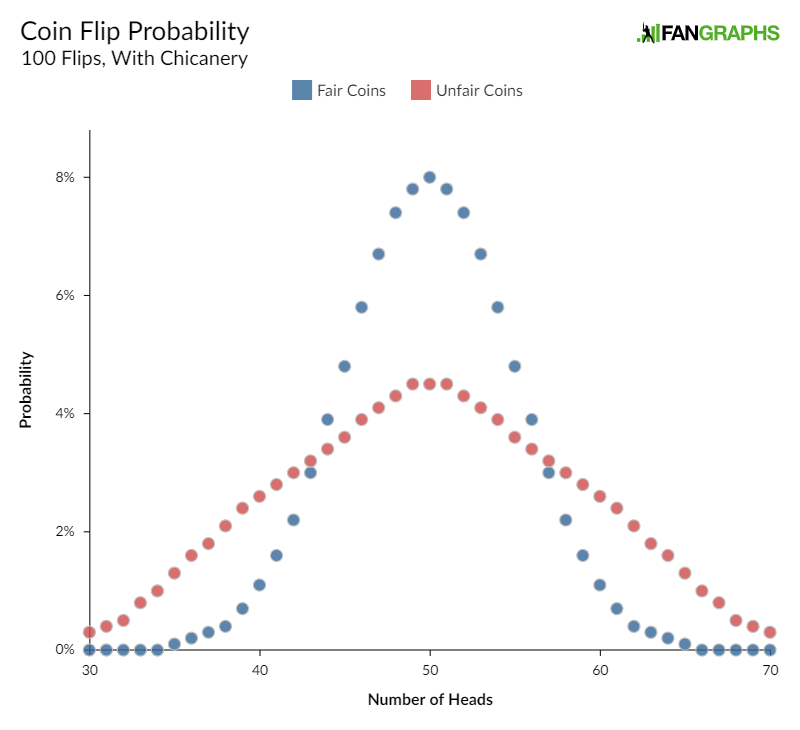
That the underlying probabilities are uncertain, even knowing that it’ll be 50/50 on average, changes how likely outlier results are. With your fair coins, you had a 96.5% chance that you’d flip heads 40 to 60 times. Drawing from your slightly doctored coins, you’d now only expect that to happen about three-quarters of the time.
The same principle applies in baseball. We don’t actually know if our .300 hitter is really a .300 hitter. You don’t even know that after a season in which they actually hit .300. Problem is, there’s nothing to tell you whether that dude hitting .300 was a .300 hitter, a lucky .290 hitter, or an unlucky .310 hitter. That difference matters for projecting outliers because not knowing these things leads to longer tails, more outliers, and thus, more .400 seasons.
Here are two scenarios for a player we believe is a .300 hitter in a 200 at-bat season. The first scenario is perfect knowledge: we know for a fact that the player is “truly” a .300 hitter. The second scenario, which I’m dubbing “binomial knowledge,” assumes that the player’s underlying batting average ability over the 200 at-bats is itself a binomial distribution, centered around .300:
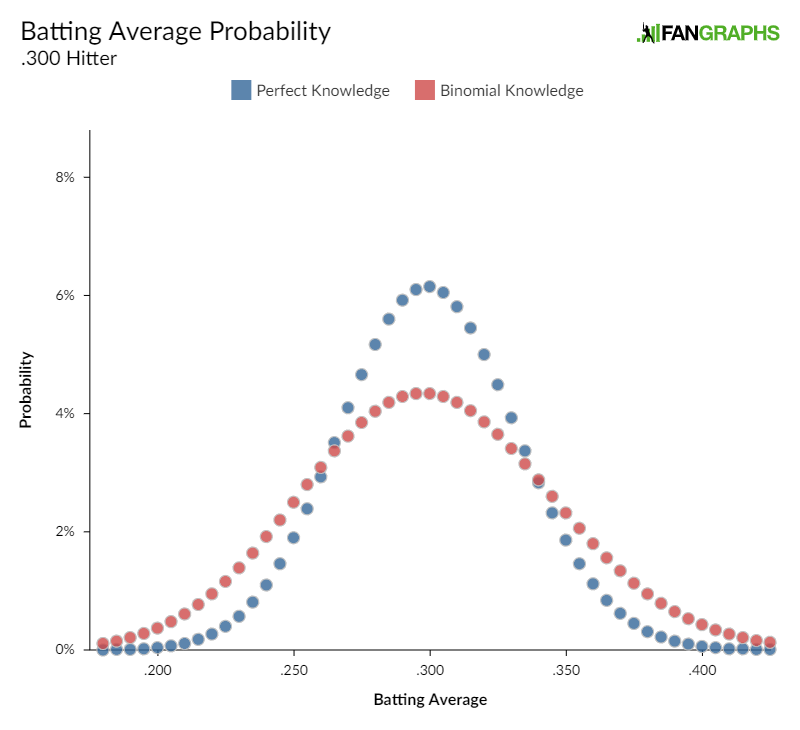
To look at this another way, here’s the .400 batting average probability for players of varying batting averages, with the same two levels of underlying knowledge:
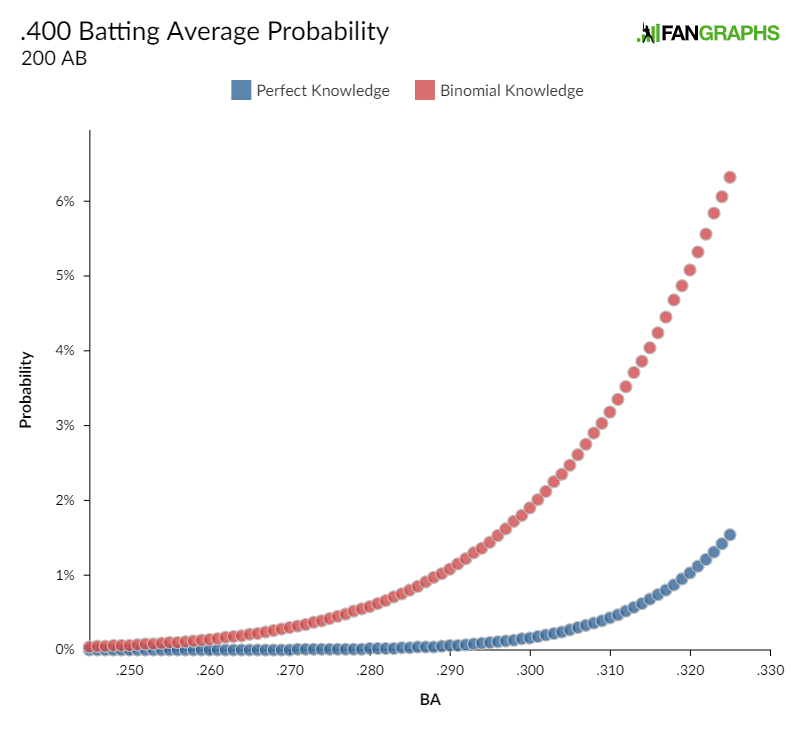
Now, nothing is quite this easy, but the idea is to give you an idea why .400 batting average seasons are more likely than one would expect from just looking at batting average in the same way as you look at coin flips.
When I developed in-season projections for ZiPS, it involved a lot of slices of seasons of baseball history. To be more precise, I looked at every possible run of at-bats for every player in history. For example, a player with 600 plate appearance has 600 one-PA segments, 599 overlapping two-PA segments, etc. This allowed ZiPS to gauge how volatile players are, which is useful when making projections. Given the assumed plate appearances for each of our 186 qualifying players, ZiPS can estimate the probability of .400 seasons with the historical knowledge of just how volatile baseball players are:
| Player | .400 Probability | One-in |
|---|---|---|
| Luis Arraez | 0.90% | 111 |
| Jose Altuve | 0.77% | 130 |
| Christian Yelich | 0.64% | 155 |
| Juan Soto | 0.63% | 158 |
| Freddie Freeman | 0.62% | 160 |
| Mike Trout | 0.58% | 171 |
| Daniel Murphy | 0.50% | 198 |
| Nolan Arenado | 0.42% | 237 |
| Yordan Alvarez | 0.36% | 278 |
| Charlie Blackmon | 0.36% | 281 |
| Mookie Betts | 0.30% | 332 |
| Cody Bellinger | 0.28% | 357 |
| J.D. Martinez | 0.28% | 362 |
| Michael Brantley | 0.24% | 424 |
| Howie Kendrick | 0.22% | 451 |
| DJ LeMahieu | 0.21% | 475 |
| Jean Segura | 0.18% | 549 |
| Ozzie Albies | 0.18% | 555 |
| Rafael Devers | 0.17% | 576 |
| Alex Bregman | 0.17% | 591 |
| Justin Turner | 0.16% | 623 |
| Ketel Marte | 0.15% | 648 |
| Jeff McNeil | 0.15% | 671 |
| Gleyber Torres | 0.14% | 694 |
| Francisco Lindor | 0.14% | 705 |
Players have hit .400 over two-month stretches of the season in modern baseball, so we know it’s far from impossible. Craig talked about some of the notable .400 runs. Chris Cwik of Yahoo talked about a few other .400 runs. And Tony Gwynn, as elite a contact hitter as we’ve seen in modern baseball, successfully maintained a .400 batting average over 183 games, not just a measly 60!
There isn’t a single player projected to have better than a one-in-100 shot at a .400 batting average, but it’s plausible for a lot of hitters. When I run the probabilities for all 186 players, I get a 9.5% chance of someone hitting .400 in 2020. 9.5% doesn’t sound like a high percentage, but that’s a better probability than there was of a Pete Alonso home run in any given at-bat in 2019. Were you absolutely shocked if Alonso hit a dinger?
Would a .400 hitter have a giant asterisk in a season such as this? Of course. But who cares? A .400 chase would be a lot of fun and while the first priority for a 2020 season is keeping everyone as healthy as possible, given how this year has gone for the world thus far, “fun” is a nice secondary goal.
Dan Szymborski is a senior writer for FanGraphs and the developer of the ZiPS projection system. He was a writer for ESPN.com from 2010-2018, a regular guest on a number of radio shows and podcasts, and a voting BBWAA member. He also maintains a terrible Twitter account at @DSzymborski.
Tom?
Late night typo on the headline. Already been fixed, but I will definitely carry the shame to the grave!
I’m going to put the odds at someone toppling “Tom” Williams’ career-high batting average this year at 100%:
https://www.fangraphs.com/players/tom-williams/1014041/stats?position=P/OF