
Trevor Story Might Be Going Too Far
Trevor Story was one of the great surprises of 2016. He continues to be of interest early in 2017.
Story has always been a fly-ball hitter, which is an attractive trait for a player who calls Coors Field home. In his eight minor-league stops, Story hit more fly balls than ground balls six times. As a rookie last season, he posted a 0.62 GB/FB ratio and a 47.1 FB%.
This season?
Story has gone full Schimpf on us. He ranks second only to Schimpf in GB/FB ratio and second in GB/FB ratio (minimum 100 plate appearances) since batted-ball ratios have been recorded.
Story was already an extreme fly-ball hitter. Now he’s even more extreme — nearly the most extreme on record.
| # | Season | Name | Team | G | PA | wRC+ | GB/FB |
|---|---|---|---|---|---|---|---|
| 1 | 2017 | Ryan Schimpf | Padres | 26 | 101 | 93 | 0.25 |
| 2 | 2017 | Trevor Story | Rockies | 27 | 107 | 62 | 0.26 |
| 3 | 2010 | Rod Barajas | – – – | 99 | 339 | 93 | 0.29 |
| 4 | 2016 | Ryan Schimpf | Padres | 89 | 330 | 129 | 0.30 |
| 5 | 2011 | Rod Barajas | Dodgers | 98 | 337 | 97 | 0.34 |
| 6 | 2015 | Chris Parmelee | Orioles | 32 | 102 | 82 | 0.37 |
| 7 | 2011 | Henry Blanco | Diamondbacks | 37 | 112 | 132 | 0.38 |
| 8 | 2008 | Russell Branyan | Brewers | 50 | 152 | 133 | 0.38 |
| 9 | 2012 | Rod Barajas | Pirates | 104 | 361 | 70 | 0.42 |
| 10 | 2013 | Scott Hairston | – – – | 85 | 174 | 73 | 0.44 |
| 11 | 2009 | Mat Gamel | Brewers | 61 | 148 | 100 | 0.45 |
| 12 | 2009 | Chris Young | Diamondbacks | 134 | 501 | 82 | 0.47 |
| 13 | 2016 | David Wright | Mets | 37 | 164 | 117 | 0.48 |
| 14 | 2010 | Jason Varitek | Red Sox | 39 | 123 | 96 | 0.48 |
| 15 | 2010 | Aramis Ramirez | Cubs | 124 | 507 | 94 | 0.48 |
| 16 | 2017 | Joey Gallo | Rangers | 28 | 105 | 129 | 0.48 |
| 17 | 2007 | Jonny Gomes | Devil Rays | 107 | 394 | 104 | 0.50 |
| 18 | 2017 | Jose Bautista | Blue Jays | 28 | 125 | 79 | 0.50 |
| 19 | 2014 | Anthony Recker | Mets | 58 | 189 | 75 | 0.51 |
| 20 | 2010 | Shelley Duncan | Indians | 85 | 259 | 102 | 0.51 |
Story’s proclivity for fly balls doesn’t appear to be the result of fluky, early-season sample size. Consider: his average launch angle is 32 degrees, nearly double his 2016 average (16.7 degrees). A number of batted-ball metrics are near stabilization points. In the majors, Story ranks second only to Schimpf (33.1 degrees) in average launch angle. I haven’t seen any reports on Story’s apparent swing alterations or changes to philosophy early this season, but it appears as though he’s up to something.
We’ve written quite a bit about the uppercut philosophy this spring, and more and more MLB hitters appear to be buying in. The league’s average launch angle has inched up from 10.0 degrees in 2015, to 10.6 degrees in 2016, to 10.9 in 2017.
The question is, when does a hitter become too extreme in approach?
Story’s strikeout rate now sits just under 40%. His swinging-strike rate is above 16%. He’s hit a ton of infield pop ups — which of course, aren’t great for a player’s BABIP. Story has a .170/.278/.404 slash line.
Is Story too extreme? Earlier this week Eno Sarris considered whether hitters might have their own ideal launch angles at which exit velocity peaks.
Story has an average exit velocity this season of 89.3 mph, about the MLB average. But his 95 mph average exit velo on fly balls is above the league average (91.5 mph) by that particular measure. Story appears to be acting rationally if he is, indeed, in search of maximizing his fly-ball output and slugging percentage.
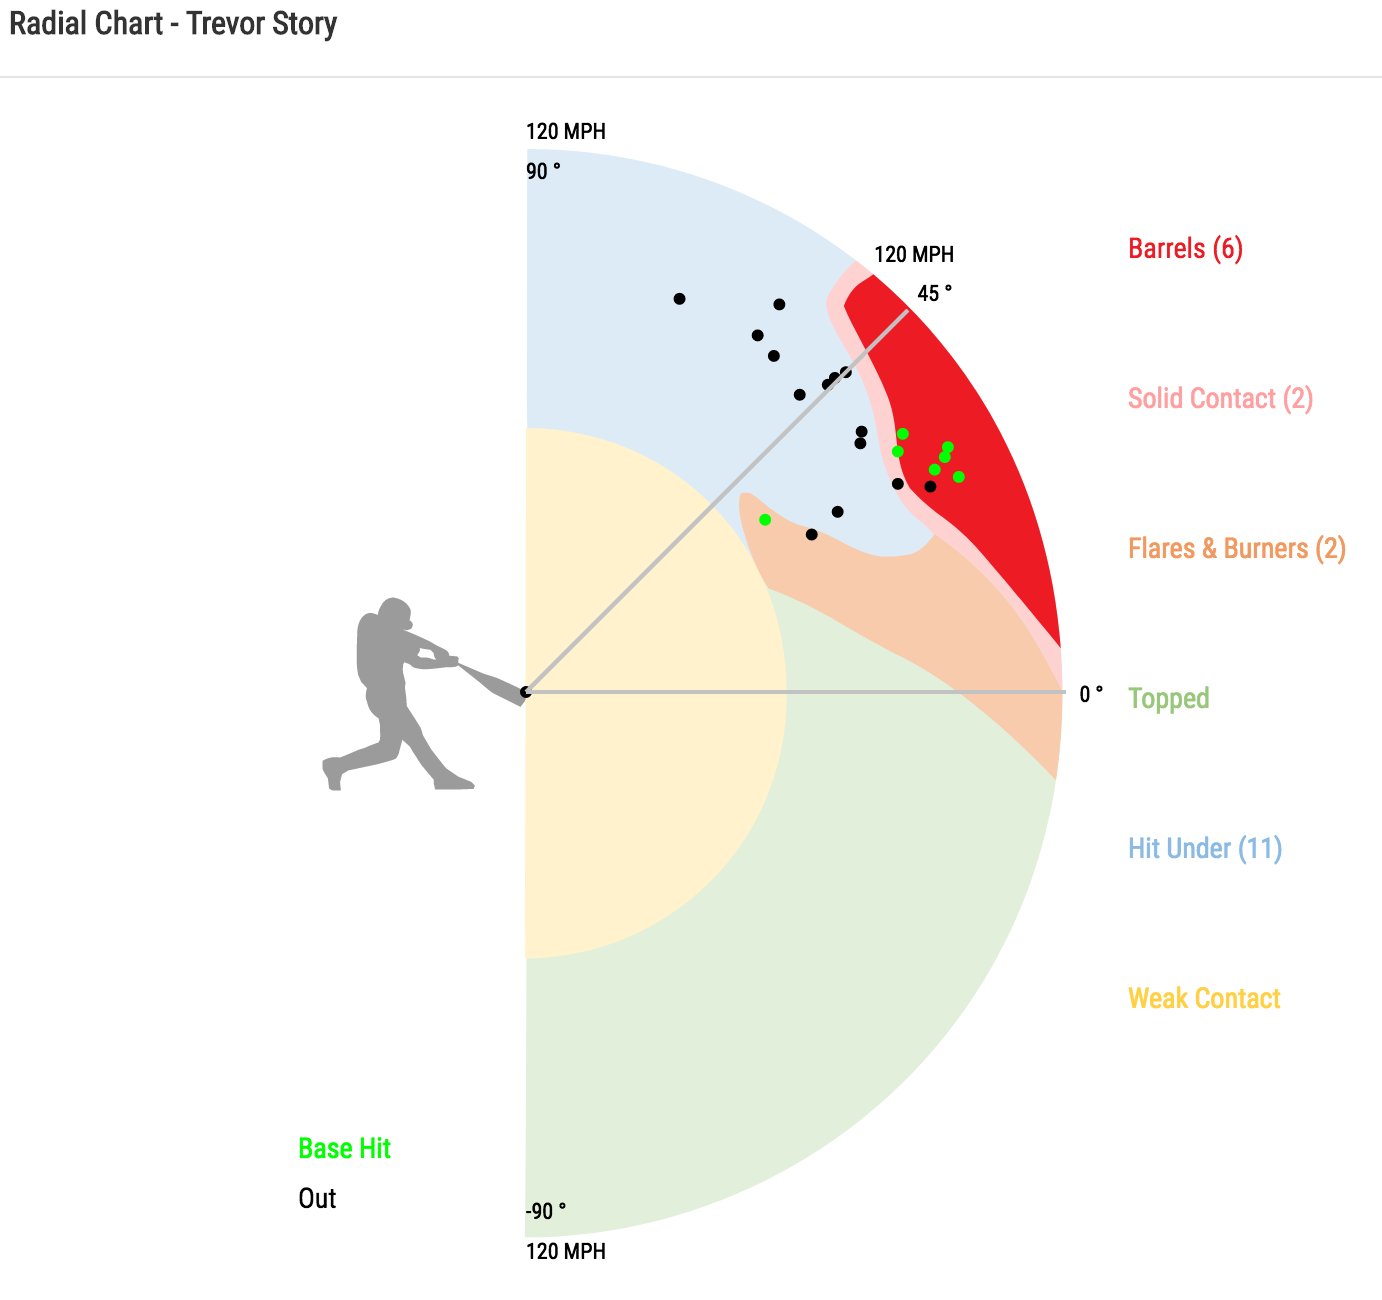
But there are consequences for any change in plans or swing plane.
Story’s whiff rate on four-seam fastballs has increased from 11.1% to nearly 14% as pitchers appear to be working him up in the zone more often with four-seamers, perhaps getting over the top of his lofted swing.
Consider the location of four-seam fastballs against Story in 2016 via this Baseball Savant heat map:

And consider the location of four-seam fastballs against Story in 2017:
 17
17
Here are Story’s whiffs on four-seam fastballs in 2016:

And Story’s whiffs on four-seam fastballs in 2017:

Again, those locations are generally elevated or above the zone.
Story told the Denver Post that he isn’t concerned about his early-season strikeout totals:
“It’s early, and I’ve missed a lot of pitches that I should have put in play,” Story said. “So I can see my strikeouts going down soon. I’m missing some pitches just a tick, fouling them off. But I think I’m seeing the ball well and I’m really close.”
Then there’s the pop-up issue. While fly balls are generally a good thing, infield pop ups certainly are not — and his infield-fly rate has jumped from 8.8% last season to 22.9% in early May.
Story is still hitting a fair amount of home runs with six on the season and an HR/FB of 17.3%. When he connects, it’s pleasing to the eye. He certainly appears to have a swing designed to lift:
While he’s hitting home runs, his strikeouts are up, perhaps with pitchers trying get above a swing designed for loft. His infield pop ups are up. His line-drive rate sits at a paltry 15.4%.
We can understand why Story is chasing fly balls, why he’s trying to become an even more extreme fly-ball hitter. But perhaps he’s reached a point of diminishing returns. Maybe Story is really just a tick off, maybe he will soon be driving more balls out of the park and reducing his strikeout rate. We’ll see. But perhaps Story is more likely evidence that you can go too far in search of the fly ball, the home run, in regard to any approach.
A Cleveland native, FanGraphs writer Travis Sawchik is the author of the New York Times bestselling book, Big Data Baseball. He also contributes to The Athletic Cleveland, and has written for the Pittsburgh Tribune-Review, among other outlets. Follow him on Twitter @Travis_Sawchik.
I think Eno’s point that every hitter has an ideal swing–and that differs depending on the individual’s coordination, height, distribution of strength, etc–is absolutely correct. But part of the key to understanding it is that when you change your swing a lot of things could change other than the launch angle. I’m really skeptical of any one-size-fits-all approach to something like hitting a baseball which requires that much amount of coordination and involves players with different heights, strength, reaction time, arm length, and so on.
Most of Story’s increase in flyballs have come in the form of popups. As a percentage of all his plate appearances, he is now striking out or popping up 46.3% of the time (up from 33.7% last year). His LD% has also dropped dramatically. This is not an effective strategy.
30 degrees is definitely too much. Keep in mind we are talking average, and the ideal HR angles is 28 degrees I think and if the average is above that almost all of the right half of the bell curve is useless (pop ups or outfield flies) because if the average is 30 half of the balls will be above 30.
Generally flyball power hitters like chris Davis are around 15 to 20 and even that starts to slightly depress babip.
The best angle for babip is around 10 degrees and doubles average around 20 degrees so you definitely want to cover that range too. For slugging of course 30 is perfect but basically everything between 10 and 30 degrees is productive so you want to fit your bell curve so that it peaks in the middle of that and the above 30 and below 10 become the edges.
The opposite is true when you LA is like 8 degrees. 8 degrees is very productive considering babip (over .600) but it also means half of your balls will be below that (grounders).you also miss out much of the extra base range.
Usually the “all-round power hitters” like miggy, trout… who hit for high babip and power have average launch angles of about 12-14 degrees and the more extreme pure sluggers are 15 to 20.
You always have to consider there is a bell curve and you are going to miss towards both ends (albeit I’m not sure whether better hitters maybe have a narrower range – that would be an interesting research project too…) and it probably would be possible to predict grounder, pop up and weak flies (40 to 50 degrees or so) based on average launch angles.
Hitters under 10 can definitely benefit from launch angle elevation (even without great power) and probably 11 to 12 guys also (if they have plus EV) but above that it might not make sense because if you are like 14 to 15 you still will get enough “misses ” in the HR range but you are productive to both sides of the peak of the curve.
I think 20 degrees is about the highest average number that is productive, above that probably also indicates some bad contact.
This is really detailed and super-interesting logic but I have no idea where you’re getting this from. Can you tell us more about the data that you’re basing this on?
Tom Tango’s Barreled Balls, used by statcast. Statcast Glossary entry here.
http://m.mlb.com/glossary/statcast/barrel
Thanks. I don’t see how this relates to Dominikk85’s post. Maybe I just don’t know how to use Statcast’s database but I’m trying to pull the launch angle for different hitters and I’m not getting anywhere. I find the logic that Dominikk85 is using convincing, but I haven’t seen this written up anywhere before and I wanted to check for myself. This might be a good project–looking at the distributions of launch angle and different hitting outcomes (this may have already been done, but I’ve not seen anything this detailed…everything I’ve seen here has just said “go higher! go higher!”).
Im not that good at it either, I thought you were mostly wondering about his assertion that 28 degrees is optimal (barrels shows how the range grows outward).
I want to ask someone to create a heat map of EV and launch angle. I run Baseballsavant on my phone while I watch games, and my observation is that there is a second high hit-probability zone for medium to lower-medium EV balls hit in the teens launch angle – 78-90 mph balls in that range have hit probabilities in the 80s and 90s frequently, because they are just over the head of infielders and are very reliably singles. Then there’s a point where hit prob drops, because the ball is hit hard enough to reach the outfielder, and then it goes up again because it’s now hit hard enough to go over the outfielder’s head.
The second part of his assertion is stuff that seems true to me watching statcast data every day during games, but I couldn’t manipulate it well enough to create that kind of chart myself.
I think the EV/LA heatmap of hit probability would be super interesting, though.
Its definitely true that launch angles above the mid-30s are very reliably outs unless they are absolutely hammered, whereas a lot of moderately hit balls with LA between 10-25 are singles.
Balls with positive LAs that are under 7 or so are often caught by infielders or still hit the ground before being fielded – a lot of 2-3 degree LA hits are 1-2 hoppers in the infield. If those are hit to the holes they are base hits, but they are outs a lot too.
Generally balls above 20 degrees are much more velo sensitive. 30 degrees at 105 is a bomb but at 90 it is a sure out. Between 10 and 20 it is mostly a hit regardless of EV. Since not every ball is crushed that means on average it is for most hitters more productive to hit it at 20.
You want balls in the 30 degree range but you definitely want to cover most of the 10 to 30 range.
Here it is! Hat tip to Jeff or Ben.
http://www.hardballtimes.com/toward-a-probability-distribution-over-batted-ball-trajectories/
The LA you can find clicking on the mlb.com player page. Unfortunately statcast doesn’t allow to filter for LA I think, I just browsed a lot of player pages.
The BABIP data on LA I found here
http://diamondkinetics.com/high-babip-swing-vs-home-run-swing/
Regarding the bell curve I once saw an article on fangraphs which showed an LA distribution.
The swing plane does affect LA and especially peak velocity at certain LA but it is still a round bat and a too high or low contact leads to lower or higher LAs. However a steeper swing plane gives you a better chance to hit the ball square in the air.
However generally most HR range fly balls are not hit square the LA is a combination of upward attack angle by the bat and hitting the ball slightly below center. Zepp has measured attack angles from sluggers they use for their advertisements (Donaldson,ortiz,trout,goldschmidt) and they were around plus 15 degrees uppercut.
It is a compromise. For optimum power you would swing at like plus 20 degrees and for best contact plus 5-10 because that mean you match the downward angle of the pitch with the swing plane. Most great sluggers are in between around 15. Guys like schimpf (which is basically just schimpf:)) are probably above plus 20 upswing and they pay a consistency price for it.
Regarding the optimum ranges I saw a tweet by statcast. It said singles averaged 9 degrees, doubles and triples like 18 to 20 and HR 28 degrees. The optimum HR distance is not quite linear. Balistically above 30 degrees would be better but aerodynamically a lower LA is better. Air drag increases at higher velos so at higher EVs lower angles can cbe better but that is only a matter of a couple degrees, generally peak is in the upper 20s.
How do we know that this is a conscious effort on Story’s part and not just the result of being pitched differently?
Edit: I had posted a bit more thinking that the plots were from pitcher’s perspective. My basic question remains, it looks like he’s being pitched to a hole in his swing, but my reasoning was flawed as to how this might have been achieved.
Well, we don’t know for sure, but the dramatic change in his launch angle seems to be indicative of … something. I haven’t had a chance to catch the Rockies in Pittsburgh this year, and I haven’t seen any reports. So it will be interesting to hear what Story if someone eventually asks him about process.
Exactly, I was just going to type that maybe Story is selling out for more power, as if he didn’t have enough already.
The Radial Chart above is probably the coolest use of StatCast data I’ve ever seen. Is there a place where they can be viewed for more players or was that custom built for this article?
Once again, great work Travis.
We need an article titled “Rod Barajas and the Flyball Revolution”.
I’m not sure if its intentional, but it seems you make the assumption in this piece that there’s a positive correlation between a flyball oriented swing-path and IFFB% — but if you look at the data, that’s just not true, and even for the last few years, it seems as though the correlation between GB/FB ratio and IFFB% is negative.
That’s just to say, IFFBs can be the result of a swing flaw, but can also be about timing. When a batter gets out on their front foot too early, that causes the back shoulder to drop and a swing under the ball. So including IFFBs in your analysis of launch angle is potentially flawed. I’d guess if you corrected out IFFBs from Story’s 2016 and 2017 BBEs, you’d see a lot more consistent launch angle from 2016 to 2017.
So I think the real question with Story isn’t about his swing path or FB tendencies, but what his true skill level relative to IFFB% — by his MiLB numbers, it looks like 2017 is more reflective than 2016 was of his true skill, and if that’s the case, combined with the Ks, his career could be in trouble…
He us definitely not squaring those balls up and high heat does tend to induce pop ups.
However I could see that partly being a result of a too steep uppercut. Generally uppercuts are great to hit low pitches because they have more of a downward plane.
High pitches are more level so it is easier to square them up with a more level swing (they are still not totally flat but maybe just 3-5 degrees down and not 8-10, so ideal would still be a very slight and small uppercut). If he has too much uppercut he might have trouble getting on plane with those high pitches and pitchers try to exploit that by throwing it above his “loop” causing him to miss under.
You are of course right that he isn’t swinging up at 50 degrees and squaring up pop ups, it probably is more of an indirect effect.
Kris Bryant said before last season that he wanted his swing to become more level to catch up with upper zone half fastballs better and he actually did it I think. He still wants uppercut but just not at much.
Guys who swing at negative or maybe plus 4 degrees or so might benefit from swinging up more but for guys above 20 degrees attack angle the opposite might be true.
Great read. Story’s approach is definitely concerning, given the probably unrealistic expectations placed on him by his great rookie year. He basically strikes out/pops out/hits a home run, and there are definitely times against some of the better pitchers in the league where he just looks overmatched.
I think the batting line that’s most realistic for him to hover around given his current approach is a 225/340/445 or so, which is plenty good for a plus defender at a premium position most places, but not good enough for Trevor in Coors field with more of an average defensive profile.
Definitely wondering what Bud Black and the front office will do if he can’t cut his k% down enough to become effective at the plate, especially if the Rockies are still looking at a chance to make a playoff run. Would they move Desmond back to SS especially if Reynolds keeps mashing, and let Story try and force his way back into the starting job? Only time will tell. As a fan of course I hope he figures it out, but a part of me (the all business, professional, heartless part) also thinks that I’d rather watch meaningful games in September/October than wait for him to put it back together and maybe miss the WC by a game or two.