The Weather of Park Factors
During the Sportscenter running before the start of yesterday’s World Series game, ESPN did a segment on some trends associated with cold weather* baseball. The numbers discussed ranged from biometric data (your grip strength and reaction time ability both decrease dramatically in cold weather) and some of the resulting baseball numbers such as that batting average drops and errors increase in cold weather.
*Link goes to one produced about football, but the same biometric data applies.
I do not think any of the above should surprise you. I found it fairly intuitive. I can recall with great clarity that my fingers do not seem as dexterous when suffering from cold. What I hadn’t done before though was make the explicit connection between the biological nuisances of cold and the dynamics of a baseball game. Think about how reduced grip strength can impact a pitcher. Some of his control is going to be diminished, but probably not evenly so as offspeed pitches require more of a grip than a fastball does. And writing of fastballs, think about how an increase in reaction time affects a hitter trying to distinguish between pitches and then make contact with a 90+mph pitch.
Intrigued, I turned to the holy Retrosheet and its temperature data for games. The 2011 dataset is not out yet, so I poked around recent years and then got distracted by something else and then another something else and then eventually came back and plotted the average temperature for the 2010 season on a map.
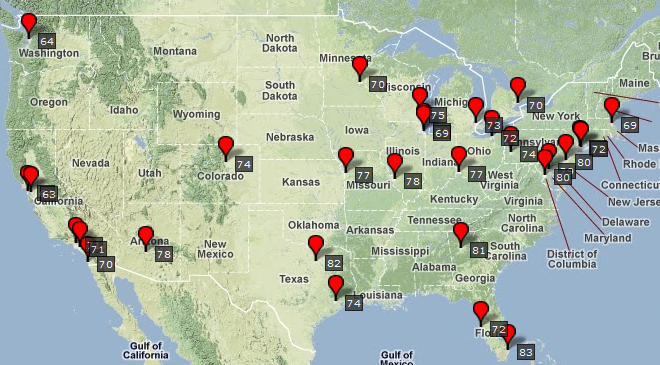
Oakland checked in with the lowest average temperature and Miami the highest. Most parks are where you’d expect, but surprises do exist. As not someone relying on a few visits and the stereotype, I never would have thought San Diego would be so low. Perhaps that’s an aberration, I’m not sure where Retrosheet gets their temperature data, but perhaps it reflects the reality of a coastal city.
A game played in 40-degree weather is different from a game played in 80-degree weather just as a game played in Arlington is different from a game played in Seattle. Obviously, but also the two are connected. Part of what makes Arlington such a hitter’s park is the higher temperature. Part of what makes Safeco such a pitcher’s park is the lower temperature. The effects get roped into and considered “park factors”, but they’re more factors of the environment than the park itself. The two are related, but worth remembering. Parks and their location have clear and subtle effects on the game. Where the sun sets, what the hitters’ eye looks like, where the wind blows in from, the height and configuration of the fences both in fair and foul territory are all examples. Temperature is another. Consider that decrease in reaction speed the next time somebody asks you how a park can impact strikeout rate.
Matthew Carruth is a software engineer who has been fascinated with baseball statistics since age five. When not dissecting baseball, he is watching hockey or playing soccer.
I did an analysis a few years ago about the “carry” of a fly ball. Here is a link:
http://webusers.npl.illinois.edu/~a-nathan/pob/carry/carry.html. It involves a precise definition of “carry” and an analysis of the carry in different ball parks. The results confirm what you say: The carry is best in Denver (because of the altitude) and in warm-weather parks (Houston, Texas, Florida) and worst in cold-weather parks (Cleveland, Oakland, Seattle, Detroit, SF). And no evidence for wind-blown home runs in Yankee Stadium (the original goal of the study).
Except you didn’t look at fly balls, you looked at home runs. The fact that a ball made it over the fence should make you estimates of carry for a park larger than the true park factor. I would expect this to be the least of an issue in New York where many batters (home and away) can put it over the fence without any help.
Would a look at park effects for specific months over many years (like say June-August vs. April-May and September) be useful at all? Would Safeco have markedly different park effects in those months or would the temperature increase be about even among all ballparks, making the change negligible when adjusted for the league?
I think the reason Seattle and SF’s average temperatures are so low is that they don’t change much with the seasons. The Midwestern cities have higher average temperatures than you would expect, because they generally have hotter summers (and colder winters) than the coastal cities at the same latitude.
So, I would expect that there would absolutely be seasonal differences between parks.
I think this is the issue here–I don’t live in San Diego, but I live in a beach city outside LA, and the difference between summer and winter can be very slight. We only have a couple weeks a year where the daytime high is above 80 or below 60, and these days don’t necessarily correspond to typical seasons. (It was in the mid-70s the first week of this January, for instance.) I wouldn’t be surprised if SD is very similar.
Might be useful! I/you/we/someone would have to formulate a hypothesis and then check to see.
I think you mean decreased quality of reaction time, i.e., increased reaction time?
As for the west coast parks, even when a place like San Diego is warm during the day, it cools off at night in the summer. It’s not like the midwest or east coast where it stays warm at night.
Yes, I meant a decrease in reaction speed i.e. how fast you react rather than a decrease in the reaction time i.e. time elapsed between stimulus and reaction. I’ve tried to make it more clear in the post
I actually did an analysis that I did not write up where I correct the carry for the known temperature and elevation effects. Moreover, whereas the article I linked to in my other comment only included 6 weeks worth of data, I have since extended the analysis to the entire 2009 season (~4300 home runs). I have the data for the 2010 season but have not done the analysis. Once the Hot Stove season begins (I guess that is tomorrow!), I revise and extend my article.
I’d be more curious to see standard deviations here, and then also attempt to use temperature to predict offensive stats within certain ballparks.
I think median might be useful here too – the median temp in Arlington is WAY higher than 80.
I agree, but medians in MySQL, ugh
I’m 99% certain I’ve previously read that a 10 degree change in temp. causes a 5 foot change in flyball distance
I think there may be more to it than just atmospherics. I could see an argument that a high temperature park would be particularly deleterious to a starting pitcher, because they exert themselves far more over the course of a game than a position player.
Similarly, I could see how position players, who spend most of their time standing around in the field or sitting on the bench, not doing anything to increase their body temperature, could be more susceptible to cold weather.
Chicago had some pretty bad april weather. Carlos Pena must of got robbed of 6-7 home runs because that brutal cold weather. 10 degree’s warmer would of helped.
Didn’t help dempster though. Dempster was killed by the home run ball in April.
Hi Matt,
If you’ve got a temperature associated with every game in the retrosheet data, then you could do something really cool and find out exactly how much the temperature affects the run scoring environment. Instead of averaging the temperature for the different parks, you could pool the games together that were played at similar temperatures and then look at what happened in those games. Were there really more errors committed on cold days and more home runs on warm days? That would be more work, but awesome.
I’ve always wondered if San Diego’s average park factor of 90 (say) was just an amalgamation of 100 in April (cold in ‘competing’ midwest parks), 95 in May, 85 in June, July and August, and 90 in September.
Humidity is presumably a factor as well.
It might be useful to look month-by-month at places where the weather really varies over the course of the season, in the northeast and midwest.
Wouldn’t it be better to define what a “cold day” is and then find the number of cold days in each city. I can’t imagine grip is thrown off much going from 100 degrees down to 80, but there is probably a threshold on the downside where it starts to make a big difference.
The foregoing discussion leads me to believe “Park factors” can (and will?) be broken down into its composite parts over time: not only for runs, but for hitting and pitching parameters as well. The energy seems high here to break out the weather factor. Other factors, such as the effect of foul area on hitting has been suggested in the past. In the past year, foul area has been shown to have an effect on strikeouts as well, with the opportunity to isolate its individual effect from the overall global park factor effect.