Welcome to Meatball Watch 2025
I’d like to present the meatball-iest pitch thrown so far in 2025:
I know, I know! I said that, but it’s just a foul ball. Hear me out, though, because I can put some data behind my claim. Here at FanGraphs, PitchingBot, our in-house pitch modeling system, looks at every single pitch thrown, regresses it against a huge database of past pitches, and uses some mathematical ingenuity to turn that into the expected outcomes of the pitch. That’s not the same as knowing which pitch is most likely to turn into a home run, but luckily, a good bit of mathematical wrangling can turn pitch grades into home run percentages.
Last year, I worked out the rough contours of converting PitchingBot grades into home run likelihood. This year, I’ve expanded that methodology to try to learn a little bit more about the pitchers doing the meatballing. If you’d like to skip through the how, you can head right down to the table labeled “Meatball Mongers.” If you’re here for the nitty gritty of turning pitch metrics into home run likelihood, though, here’s how I did it.
That Trent Thornton fastball had a lot of things working against it, and those things help explain how PitchingBot estimates the chances that a pitch will be hit for a home run. PitchingBot has a flowchart that explains how the model works. Here’s how the system assesses every pitch it grades:
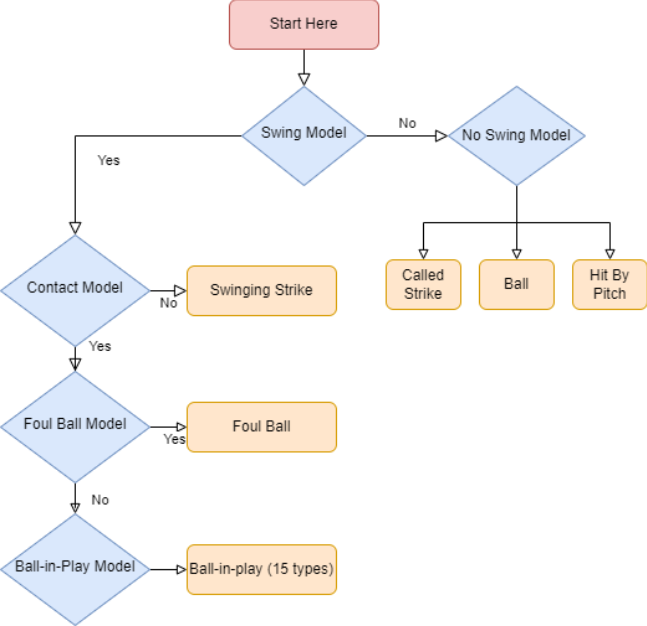
Hey, a convenient “start here” label! How great! The “swing model” takes location, count, pitch type, movement, platoon matchups, and pretty much everything else you can imagine into account and guesses at the likelihood of a batter swinging at each pitch. That Thornton fastball was down the middle in an 0-1 count, and it’s not a particularly deceptive offering. In other words, hitters often swing at fastballs like that – 92.7% of the time, per PitchingBot’s model.
Next, the model has to determine how likely the batter is to come up empty. That’s the “contact model” portion, which approximates the likelihood of a swing against any given pitch resulting in a whiff. Fastballs don’t miss many bats generally, and Thornton’s doesn’t miss many in particular. Plus, a middle-middle location is a poor way to get swings and misses. In other words, this pitch was both likely to be swung at and likely to be hit; the model gives it an expected contact rate of 81.1%.
Of course, not all contact lands in fair territory, which brings us to the foul ball model. PitchingBot estimates that contact with a fastball like this is foul about 44.9% of the time. By multiplying these values together – the odds of a swing times the odds of contact given a swing times the odds of fair contact given contact – you can work out the odds of a batter making fair contact with a given pitch. For this exact pitch, that works out to 41.4%. In other words, fastballs like this one – bad location, so-so velo, swing-heavy count – turn into balls in play 41.4% of the time. Sure, Jonathan India fouled the ball off in this instance, but the model is working in generalities.
From there, the model buckets fair contact into three different types of batted ball (grounder, line drive, fly ball) at five different velocity bands (<90, 90-95, 95-100, 100-105, 105+). To get to its pitch grades, the model approximates the likelihood of the pitch turning into contact of each type, then assigns an average run value to each type/speed bucket.
This is where my method diverges from the pitch grades you see on the website. They’re concerned with overall results, which is great. I’m looking for meatballs, though, and I don’t care how likely a given pitch is to result in, say, a screaming low line drive, or a flare to left that’s hit too softly for the outfielder to get to it. I’m only interested in home runs. Instead of working out the aggregate production, I just figured out how often batted balls with the characteristics of each type/speed bucket turned into homers. That way, I can take PitchingBot’s outputs — the likelihood of a batted ball of various types — and turn them into the only currency I care about for this article — the likelihood of a home run.
Take that Thornton pitch: The model gave it a 45% chance of a fly ball, with the two most likely outcomes being a weakly hit fly ball (<90 mph) or a smashed one (>105 mph). In aggregate, the model assigned an 18.2% chance that fair contact on this pitch would turn into a home run. That’s a phenomenally high number. Cal Raleigh is converting 14.5% of his balls in play into homers this year, the best mark in the majors. That Thornton fastball is so crushable, in other words, that the aggregate big league population would turn into Cal Raleigh if they always got to hit balls like that.
It’s hard to tell from the video, but India was all over that fastball. He smashed it foul, 100 mph off the bat and at 25 degrees, an excellent angle for home runs. It’s pretty easy to understand how that ball might have left the park. But even if you throw an eminently smashable fastball in an eminently smashable location in a count where the hitter is almost compelled to swing, the result usually isn’t a home run. In fact, my modification of the PitchingBot model estimates that this pitch had a 7.5% chance of turning into a homer.
Are you disappointed that the biggest meatball of the year didn’t leave the park? I would be, if I hadn’t tried the same exercise last year and come to a similar conclusion: no pitch is so bad that it’s likely to turn into a homer. But I think this method has plenty of merit even if it can’t predict home runs with great certainty. It passes the eye test, for one thing. Here’s the pitch with the second-highest expected home run rate of the year:
Yep, that looks pretty crushable!
And here’s number three:
Again, it doesn’t take a rocket scientist to pick up on the same things as our model. Those two pitches were lobbed down the middle by position players; of course they were crushable. Fastballs feature prominently in the list of most smashable pitches, but position player “fastballs” are even more crushable.
And you don’t have to go very far down the list of the juiciest meatballs until you get to an actual homer. Here’s the eighth-highest home run probability pitch of the year:
Again, are you surprised? Hitters take pretty aggressive swings at fastballs in 3-1 counts. Lucas Giolito doesn’t have a great fastball in the first place, and this one was both slower and had less induced vertical break than his average. It was, in other words, a sitting duck in terms of both location and stuff – a meatball. The top 100 most crushable pitches have turned into nine homers, with the model predicting seven homers across those pitches. The top 1,000 meatballs have turned into 48 homers; the model predicted 50 here, so it appears to be fairly well calibrated.
Hopefully, this method makes sense to you. Does it get every single pitch right? Probably not – the point of pitch models is that they work in the aggregate, not at the individual level. Does it flag pitches that are likely to produce swings, unlikely to miss bats, and generally look easy to hit hard? Yes indeed, which means that we can take its results, sum them up, and make some generic statements about the pitchers who have tossed these cookies.
First, I took a definition from Cameron Grove, the creator PitchingBot. He defined a meatball as a pitch that the model assigned a 3% or greater chance of being hit for a homer. By doing the same, I was able to create “meatball rate,” the percentage of pitches that are highly likely to be hit for home runs. Only about 3.5% of all the pitches thrown in the majors this year are that hittable, and only about 0.8% of pitches thrown this year have left the park, so you can think of a meatball as a pitch that’s four times as likely to get clobbered as a random offering. Here are the pitchers who toss those most frequently:
| Pitcher | Meatball Rate | Meatballs | xHR | xHR/100 | HR | HR/100 |
|---|---|---|---|---|---|---|
| Valente Bellozo | 8.5% | 100 | 12.2 | 1.04 | 8 | 0.68 |
| Tyler Anderson | 8.5% | 199 | 23.3 | 0.99 | 28 | 1.20 |
| Clayton Kershaw | 8.3% | 111 | 13.4 | 1.00 | 7 | 0.52 |
| Nick Martinez | 7.1% | 169 | 23.6 | 0.99 | 21 | 0.88 |
| Bailey Ober | 7.0% | 137 | 19 | 0.97 | 29 | 1.45 |
| Bailey Falter | 6.9% | 134 | 19.7 | 1.01 | 19 | 0.97 |
| Jameson Taillon | 6.8% | 112 | 16.5 | 1.00 | 23 | 1.40 |
| Simeon Woods Richardson | 6.8% | 98 | 13.9 | 0.96 | 15 | 1.03 |
| Miles Mikolas | 6.7% | 139 | 20.7 | 1.00 | 24 | 1.16 |
| Jack Flaherty | 6.6% | 158 | 20.6 | 0.87 | 22 | 0.89 |
A quick note: xHR is just the sum of the home run probabilities for each pitch a pitcher has thrown this year. xHR/100 is expected home runs per 100 pitches, which puts everyone on a similar scale; you can think of it broadly as home runs per start for starters, since 100 pitches is such a standard appearance length.
As you can see, this metric correlates quite well with actual homer-prone pitchers. I would be shocked if Tyler Anderson weren’t on this list, in fact. Even at his most effective, he throws a ton of low-velo four-seam fastballs in the heart of the strike zone. He doesn’t give up an inordinate number of home runs per fly ball or anything, but his pitches induce tons of swings, few whiffs, and a bunch of fly balls, and that’s in a good year – in 2025, he’s getting torched, and this list helps explain why.
In fact, I think the most interesting name on here is the outlier: Clayton Kershaw. His 2025 season has been quite strange so far: a career-low strikeout rate, a career-low swinging strike rate, a career-low fastball velocity… but also one of the lowest home run rates of his career. The model would say that his good home run fortune hasn’t been earned. I concur with that assessment – watching Kershaw’s starts this year has made me say “boy, I thought that pitch would get smashed” more than I ever have before.
To be clear, throwing a ton of meatballs isn’t the worst thing you can do as a pitcher. None of these guys are elite options, but they’re hardly unplayable. A homer might be the worst result, but there are worse pitches you can throw. A pitch that always gets taken for a ball is abysmal, for example. Even the most homer-prone pitches get their fair share of foul balls, takes, easy outs, and so on. Hum one a foot over the batter’s head or bounce it in the dirt, and that’s just free count leverage for the hitter, and often free baserunners.
On the other side of the ledger, avoiding crushable pitches is only useful if you can keep the ball in the strike zone often enough to take advantage of your ability to suppress contact quality. That said, pitchers who throw few meatballs have a wider range of acceptable strikeout and walk rates. The king of avoiding home runs this year? José Soriano, who has tossed 2,581 pitches and only thrown 11 meatballs. He’s only striking out 21% of opponents, and he’s walking a ghastly 10%, but baserunners aren’t quite so devastating when you run huge groundball rates and almost never give your opponents a get-out-of-jail-free card via a four-seamer right down main street.
Soriano has something in common with some other standouts in this category, in that he throws a good sinker. Logan Webb is consistently excellent at this skill; he’s in the top 10 for lowest meatball rate in every year I have data for. Cristopher Sánchez didn’t miss the top 10 by much, and he was second to Webb last year. Abner Uribe (sinker-dominant) has the lowest meatball rate in the majors this season; Brendon Little (also sinker-dominant) has the lowest xHR/100. That’s another great sign: These guys are elite at avoiding home runs, and our model is flagging them as elite at avoiding home runs.
Is this a little bit of a gimmick stat? Sure. Pitching isn’t just about whether or not you give up homers, as I keep mentioning. PitchingBot grades Seth Lugo as the worst qualified starter in baseball this year, but he’s smack dab in the middle of the pack when it comes to expected home runs. The problem is that he’s running Soriano’s uninspiring strikeout and walk numbers, but doing so while throwing a ton of four-seamers and cutters. The extra baserunners and lack of free outs matter a lot more when you combine them with home runs, in other words.
Still, I think that the model outputs here are worth paying attention to. “That pitch looked dangerously hittable” is an important eye test. I use it when I’m evaluating pitchers, and I’d love to have a slightly more rigorous way of measuring that. Both meatball rate and xHR/100 do a pretty good job of this, at least in my opinion, so I’m happy to add them to my consideration of any given starter. And hey, you can too! Here’s a list of every pitcher in baseball this year (min. 1,000 pitches), along with the relevant PitchingBot home run estimators. Happy meatballing.
Ben is a writer at FanGraphs. He can be found on Bluesky @benclemens.
I suspect part of the reason hitters don’t get loud contact at a much higher rate against meatballs is that they aren’t *expecting* a meatball. “Wow, I thought that was going to have movement on it.” At least, that’s my layman’s take.