
Welcome to PhamGraphs
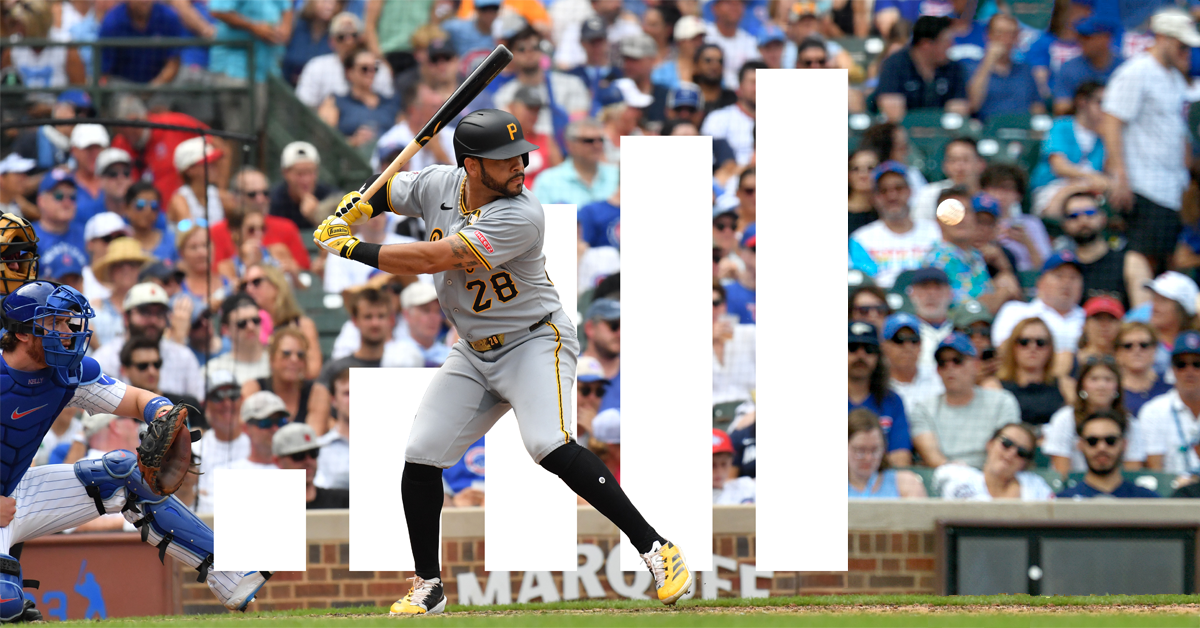
“It’s not being quantified like it should.” That’s what Tommy Pham told Will Sammon and Eno Sarris of The Athletic. Pham isn’t your stereotypical ballplayer who hates advanced stats. He’s a visionary who wants them to be even more advanced, to factor in even more context, to do an even better job of turning every tiny thing that transpires on the field into cold, hard numbers that can be credited to or debited from a ballplayer’s account. On Monday, Sammon and Sarris published an article that described Pham’s dream of a brighter sabermetric future. “I want to create a system that is going to change all that,” he said. Tommy Pham, the old school grit-and-grinder with 12 years in the majors under his belt, wants us nerds to get even nerdier, and he’s here to help. He even has a name in mind: PhamGraphs. “It’s pretty self-explanatory,” he said.
First and foremost, we here at FanGraphs want to let Tommy Pham know that we are going to sue your ass back to the stone age for trademark infringement so incredibly flattered by this charming homage. Moreover, we are here to help. We are up for the challenge. We want in. Welcome to PhamGraphs.

I can relate to Pham’s plight personally, because once upon a time, I, too, created my own FanGraphs knockoff. Specifically, I experienced a burgeoning enthusiasm for apples in the summer of 2016, so I started a spreadsheet where I’d list all the apples I ate, rate them on a scale of one to five, and write a review. The spreadsheet was titled AppleGraphs, and I figured it that if I really liked tracking my apples, I’d eventually turn it into a blog. Instead, I kept it up for a couple months and then forgot about it. I never showed it to anybody. Here’s an excerpt.
| Date | Cultivar | Source | Grown | Rating | Descriptors |
|---|---|---|---|---|---|
| 8/2/2016 | Fuji | Trader Joe’s | Chile | 4 | Gorgeous |
I wrote a total of 13 entries before it petered out (though if some venture capitalist is reading this and wants to throw a million dollars my way, I will gladly resurrect AppleGraphs as a blog or a newsletter or a zine or whatever unwieldy medium you and you blood money would prefer). You can read the whole thing here, but only if you really, really don’t have anything better to do, because, once again, it was just a spreadsheet where I described apples as a way of killing time at my desk until FanGraphs published a new article for me to read.
My extraordinarily roundabout point here is that, as someone with experience ripping off David Appelman (with apples, no less), I am determined to take Pham very seriously and answer his points as best I can, one by one. However, I want to note first that Pham’s comments revealed two overarching concerns. First, he wants the numbers to feature more context, to get into deserved performance rather than actual performance. Weighted Runs Created Plus, our flagship hitting metric, is park-adjusted and league-adjusted. The numbers are measured against the league average, which is always 100, and they’re adjusted based on the hitting environment of the park a hitter plays in. But they’re not designed to show deserved performance. They’re designed to show how well you performed relative to the league average. They don’t factor in strength of opponent or batted ball luck or a host of other factors. However, those numbers are available to Pham if he wants them. DRC+, or Deserved Runs Created Plus, is the flagship offensive metric of Baseball Prospectus. Deserved performance is what they do at BP. That may just be the site for Pham, and he may want to rethink his branding.

Actually, now that I mention it, I should probably note that Baseball Reference WAR also takes the strength of your opponent into account. The point is, Pham can keep his options open. The sabermetric community is a big tent. We’re all Pham.

That said, you have to stop somewhere. It’s impossible to factor everything in. There’s no shortage of examples. If you’re Randy Johnson and you detonate a mourning dove that divebombs into the path of your fastball, and the umpire calls the pitch a ball (which would have been the right call), should that ball really count against you? If you’re Rafael Ortega and a double falls in over your head because a territorial goose has colonized deep center field and forced you to play too shallow, should you really have your defensive metrics docked? If you’re Cody Bellinger and some room service chicken wings give you such horrendous food poisoning that you have to miss a game and bat .143 with a 24 wRC+ over the next two weeks, is that really all your fault? Shouldn’t some of the -0.2 WAR you put up over that timeframe be doled out to the chef at the hotel, to Perdue AgriBusiness, and to the chickens themselves? I could keep going all day. I’m not even done with the bird examples yet. You could keep going forever because everything’s connected. At some point, you just have to draw the line and look at what happened on the field.
Pham’s second overarching concern was, obviously, to burnish his numbers. He’s a 37-year-old free agent who is looking for a deal. He has played for nine different teams over the last five seasons and put up a combined 0.1 WAR across the last two, and he’s been on something of a media campaign recently (and not so recently). In November, Pham revealed that he’s been playing through plantar fasciitis since the second half of 2023, but, conveniently, he’s all better now. These new comments no doubt express his true beliefs, but they also seem designed to put a positive spin on his performance in order to get himself a good deal – or as Zach Crizer put it over at The Bandwagon, “Tommy Pham has some ideas about stats that would make Tommy Pham look better.”
Now let’s get to Pham’s issues. He made two particular points. The first was that playing for a losing team, especially one that loses a lot of close games like the Pirates, means that you tend to face better pitching, because all the opponents who end up beating you have to use their high-leverage arms in order to close out their victories. The close-game qualification is an important one, and it takes some of the sting out of Pham’s argument, because bad teams end up in just as many blowouts as good teams, and the leverage is low for both teams at that point. If the Phillies are blowing your doors off, they’re not going to waste Jhoan Duran in a non-save situation. Now, the back of a good team’s bullpen is sure to be better than the back of a bad team’s, but the difference isn’t going to be quite as big.
Still, Pham is right that he’s been facing tougher arms than usual. In addition to noting all the close games the Pirates played last year, he mentioned that he switched teams twice during the 2024 season, and that those moves came at inopportune times. A series of scheduling quirks caused him to catch three straight prolonged stretches where his current team was facing off against particularly stiff competition. As a result, he believed that he faced much better pitching than most batters. (He also mentioned that he discussed this with his agent, who confirmed his hunch, and I have to admit that I’m a sucker for this line of reasoning. Anyone who has ever had an argument with a significant other has heard some version of the line, “I asked my friends, and they all think I’m right and you’re wrong.” No matter how bad the fight, it’s always at least a little bit amusing.)
We checked this out, and when I say we, I mean David Appelman. David calculated the average ERA and FIP of the pitchers that every batter faced in both 2024 and 2025. In 2024, the pitchers Pham faced had a combined ERA of 4.02, the 19th-lowest among all batters with at least 400 plate appearances. That put him in the 90th percentile. In 2025, his opponents had a 4.17 ERA, which put him in the 75th percentile. He really has faced tough pitching over the last two years. It’s not unprecedented – somebody’s got to be in the 99th percentile every year (sorry Royce Lewis) – but it is real.
| Rank | Name | ERA | Rank | Name | ERA | |
|---|---|---|---|---|---|---|
| 1 | Royce Lewis | 3.84 | 206 | Cedric Mullins | 4.47 | |
| 2 | Chandler Simpson | 3.97 | 207 | Matt McLain | 4.49 | |
| 3 | Jonathan Aranda | 3.98 | 208 | Jeff McNeil | 4.50 | |
| 4 | Junior Caminero | 3.98 | 209 | Nathan Lukes | 4.50 | |
| 5 | Yandy Díaz | 4.01 | 210 | Pete Alonso | 4.50 | |
| 6 | Jake Mangum | 4.01 | 211 | Alec Bohm | 4.52 | |
| 7 | Gabriel Arias | 4.02 | 212 | Gavin Lux | 4.57 | |
| 8 | Iván Herrera | 4.03 | 213 | Brett Baty | 4.58 | |
| 9 | Ryan Jeffers | 4.05 | 214 | Austin Hays | 4.58 | |
| 10 | Josh Lowe | 4.05 | 215 | Carlos Narváez | 4.66 |
Unfortunately, Pham’s argument falls a little bit flat at this point. If you try to give him credit by regressing his performance to account for this greater degree of difficulty, you learn that the effect is much smaller than you’d expect. In 2025, Pham faced pitchers whose combined ERA was 0.08 points lower than the league average, so let’s give him credit for those extra points. There are several ways to run the numbers, but Ben Clemens showed me a quick and dirty way to do it using constants from The Book. Skip the rest of this paragraph if you don’t like math. One point of wOBA works out to roughly half a run per 600 plate appearances, and 600 plate appearances works out to roughly 141 innings. Half a run over 141 innings works out to 0.032 points of ERA. Now we have a conversion rate: one point of wOBA equals 0.032 points of ERA.
That means if we give Pham 0.08 extra points of ERA to bring him up to the league average, it only adds 2.5 points to his wOBA. That’s it. He goes from .308 to .311. Among the 215 players with at least 400 plate appearances in 2025, that takes him from the 150th-highest wOBA to the 145th.
If we use FIP rather than ERA, which Pham would presumably prefer because it’s a better indication of a pitcher’s true talent level, we’d add only 1.3 points of wOBA. (We can go even further: If we use the pitchers’ projected ERA or FIP at the time of each plate appearance according to Steamer – effectively showing how good everybody thought the pitchers were at the time – then Pham actually faced an easier slate of pitchers than the average batter!) As I mentioned earlier, DRC+ takes the strength of opponent into account, and that’s likely why it graded Pham higher than wRC+ over the last two seasons, but that bonus was just three points in 2024 (a 92 wRC+ and 95 DRC+) and four points in 2025 (a 94 wRC+ and 98 DRC+). None of this turns him into even a league-average bat. So yes, Pham faced tough pitching, but no, it doesn’t make all that much difference.
That said, I don’t want to let all these numbers get in the way of a good story. While we’re talking about all the high-leverage arms Pham has faced, we need to note that he was great in high-leverage situations. In 2025, he ran a 168 wRC+ across 40 high-leverage plate appearances, batting .355. Over the past two seasons, his 136 wRC+ in high-leverage situations puts him in the 80th percentile of all hitters (minimum 80 high-leverage plate appearances). If I were Tommy Pham, I’d be making sure that high-leverage situations were part of the conversation, too.
Pham’s second point was about how wind can play havoc with outfield defense, and here I’ll rely on an excerpt:
Pham remembers a particular play from last season that frustrated him as it related to how defensive metrics are used to value players. In a game against the Milwaukee Brewers, he was playing left field. A ball hit approximately 360 feet with a 90-mph exit velocity short-hopped the outfield wall. The wind carried it. Pham was playing in, so he couldn’t get to the ball. The play reflected poorly in his defensive numbers.
“I got docked on the ball because Statcast doesn’t factor the wind part,” Pham said. “When I learned that, I’m like, OK, if the wind’s blowing out, I need to play a little bit deeper.
“It’s a really flawed system. But it’s getting factored into our value.”
Before we get into the play in question, let’s start with the part where Pham says that he didn’t learn until age 37 that he should probably play a bit deeper when the wind is blowing out really hard. That seems – how do I put this respectfully? – unlikely to be true. Surely, this sabermetric visionary had, you know, thought about what the wind does before the year 2025. Pham makes a valid point about how defensive metrics have so far been unable to account for wind, but the example he uses to illustrate it is, by his own account, just a story about how he was positioned poorly.
Some of the details are off, but I was able to find the play in question. I understand why Pham has it stuck in his mind. It cost the Pirates a game. It was a line drive double from Caleb Durbin on May 25. It left the bat at 97.1 mph, traveled 371 feet, got over Pham’s head, and short-hopped the wall. The Pirates were leading 5-3 in the top of the eighth, and because the tying run was on second base, Pham was playing a bit shallower than usual. In 2025, the average left fielder at PNC Park played 301 feet deep, and Pham averaged 295. On this play, he was at 293 feet. He was making sure that he’d be able to hold the runner at third if Durbin singled. For that reason, I’m not so sure that he would’ve been playing deeper even if he had factored in the wind. The double scored two runs, tying the game at five, and Durbin scored the game’s deciding run when the next batter also doubled to Pham in left field.
Pham was right that the wind aided the ball a bit. Over the course of the 2025 season, 12 balls were pulled at the same launch angle and exit velocity off the same pitch type, and they traveled an average of 353 feet. This ball went an extra 17 feet. Still, his argument has several problems. The first is that Statcast only gave this ball a catch probability of 30% to begin with, thanks to the wall penalty. It graded out as a four-star play, which means that it was so difficult that it barely hurt Pham’s numbers. Second, at this stage of his career, Pham doesn’t make four-star catches anyway. His numbers going back on the ball have been bad for years now. He’s 37 and not that guy anymore (unless his plantar fasciitis really is gone forever). In fact, less than a week earlier, Elly De La Cruz hit a nearly identical ball to Pham in left field. Durbin’s ball required Pham to travel 79 feet over 4.7 seconds. De La Cruz hit his harder, but it required Pham to travel 78 feet over 4.7 seconds, and it landed in pretty much the exact same spot. On both balls, Pham had a chance to make the catch but decided to slow down — especially on De La Cruz’s — rather than risk injury by crashing into the wall.
Third, it’s also important to note that the Statcast numbers here, at least to some extent, factored in the wind already. Those catch probability numbers aren’t perfect, but this is exactly the kind of batted ball where they work well. Pham isn’t getting graded based on the launch angle and exit velocity; he’s getting graded on the hang time and the distance he had to travel. Statcast is accounting for those extra 17 feet in its grading system, and then it is knocking off some of the difficulty because the ball landed near the wall. It’s not taking off a couple extra percentage points because the wind made the ball move unexpectedly, and Pham is right that in a perfect world he would get credit for that. However, this is pretty tame in terms of wind effects. The ball didn’t change direction because of a sudden gust, and it didn’t move unpredictably due to swirling conditions. It just had a tailwind that allowed it to get on top of him. Maybe we’ll get there one day, but right now, it’s hard to imagine any system detailed enough that it could put a specific number of catch probability percentage points on just how much harder the tailwind made this play, let alone do so accurately enough to be worthwhile.
To return to the most important point, why wasn’t Pham taking the wind into account already? He got docked because he didn’t catch the ball, but he did not get docked (at least not by Statcast) for his positioning. In fact, because he started out so far from where the ball landed, Statcast gave him more leeway, reducing the catch probability, and thus the hit to his OAA. Other systems like DRP and DRS factor in positioning, and they may well have docked him for playing too shallow here. Or, maybe the opposite is true; maybe they would’ve recognized that he was playing shallow in order to hold the runner at third on a base hit, and would’ve considered his positioning to be correct even though it didn’t work out. If that were the case, perhaps they wouldn’t have held it against him either. There’s always more context to take into account, even when there are no birds in sight.
I should also note that Pham once again came close to touching on something that would have made him look great. Did you know that our splits tools allow you to check how a player performs based on the wind conditions? We can’t split out outfield defense, but it turns out that Pham is actually a great hitter when it’s windy. Over the course of his career, we have him credited with making 164 plate appearances when the wind is blowing at least 18 mph. In those plate appearances, he’s batted .354 with a 197 wRC+. Our database shows 513 players who have at least 60 plate appearances in those conditions. Pham’s 197 wRC+ ranks eighth, just a couple of spots behind Aaron Judge and Juan Soto. Yet again, Pham is doing the right thing by bringing wind into the conversation.
Before I leave you, I want to mention that, although I’ve made plenty of jokes and taken a critical eye to the issues he raised, I think Pham has the exact right attitude here. Like every player, he’s run into some bad luck at times. And, like every player, he’s also faced some good luck. Here’s a popup that turned into a double only because Pham had the good fortune to hit it to Teoscar Hernández:
Pham doesn’t sitting around thinking about all the times he got lucky, and for good reason. He plays the game at the highest level, where failure lurks around every corner. Nine years ago, right around the time I started the now-legendary AppleGraphs, I was playing in a pickup baseball league in Queens and saved this quote from Grégor Blanco. Coincidentally, it too appeared in an article by Eno Sarris:
“These things are going to happen. You go up and you go down. When you go down, you need to realize that it happens. Don’t let frustration get you. Try to simplify the game. Take some pitches, start seeing the ball again. Build that confidence again. You need to start seeing it inside yourself. ‘I got a walk! That’s good. I hit the ball hard.’ Sometimes in a streak, you hit the ball hard right at someone, and you think, ‘What do I have to do?’ Instead, say, ‘Yeah, that’s what I want. I hit the ball hard.’”
I saved it because, even in this silly adult league, I found it useful to trick myself into staying positive. When I hit a bloop single or reached on an error, I’d tell myself, ‘Great job, you got on base.’ When I lined out, I’d tell myself, ‘Great job, you hit the ball hard.’ In other words, I found a way to take something positive out of nearly every at-bat.
Pham has a tattoo that reads “Believe in Yourself” on his left arm, just below the spot where his sleeve ends. I’d be remiss if I didn’t point out that it was a huge missed opportunity for him not to spell it ‘Yourselph,’ but I’m sure the location was no accident. I’m sure the tattoo is right there so that Pham can look down to remind himself of that whenever he feels the slightest bit of doubt creep in. If he wants to create his own statistics in order to help him follow the instructions on his arm, then we here at FanGraphs and PhamGraphs are happy to do our part.
Davy Andrews is a Brooklyn-based musician and a writer at FanGraphs. He can be found on Bluesky @davyandrewsdavy.bsky.social.
This article was really cool! And visually interesting too.
I would call it phamtastic
Thanks for taking Tommy’s comments seriously. All Pham puns aside (for now), why shouldn’t players have some/more input into the metrics that evaluate their performances and inform their livelihoods? That would be less imbalanced a la Dollar Sign On The Muscle, a problematic mindset in countless ways. While most big leaguers are making these adjustments in their development and at the highest level, it’s all still a reactionary ownership system to keep salaries down. Sometimes, I think we celebrate this quant revolution to our detriment.
Do you get to tell your boss how to evaluate your performance? You can certainly make arguments to support your view of your performance, but ultimately, the people paying you get to decide what they value and how they value it.
I don’t really agree that the purpose of evaluation systems in baseball is to hold salaries down. Whatever system you use is going to give you a spectrum of players from good to bad. They have stuff like the luxury tax, arbitration, qualifying offers, etc. that are for keeping salaries down. Metrics are not, in and of themselves, part of that.
I agree it makes sense for players to suggest improvements. All for that. Maybe they’ll help identify something that could be improved in the metrics, even if it seems Pham failed to accomplish that here. But I wouldn’t want them to have any more input on it than that.
The basic problem here is that objective evaluation and “your boss evaluating your performance” are two totally separate things, often orthogonal if not contradictory, and it’s too bad that people conflate them. It’s not going to be to every player’s advantage (only Ohtani’s) to be evaluated with perfect objectivity 100% of the time, but neither is it going to be to every boss’s advantage in every negotiation to use entirely objective metrics. Even in a hypothetical state-owned baseball league with perfectly equal pay for all players, there would be a need for objective metrics — potential debates about who got the playing time, the MVP votes, and so on. I think there’s a reasonable point that sabermetrics — born out of the spirit of science — has more recently been colonized by management and its interests, but it doesn’t make sense to conclude from that that it’s pro-labor to be anti-science.
I don’t disagree with the concept that management (and labor) will selectively cite data to back up an argument. Thats been the case forever in every industry. But I do think team management are making objective evaluations in-house, even if they’re not sharing them publicly. Of course, if their evaluation says a player is worth $20m, they’re gonna try to get him to sign for less. That doesn’t mean they’ve “colonized” the data
I think the big push should be in getting arbitrators to understand advanced stats better. It’s been awhile but I spoke to a few a little over a decade ago and they were still using baseball card stats and their eyes glazed over a little when someone asked a question about wOBA. Not too long afterwards, Dellin Betances lost his arbitration case after a year in which he was the 3rd best reliever alive (by fWAR), just ahead of Chapman, who was tasked with saving games after Betances shut teams down in the 8th. The entirety of the case against him was that only closers with high save totals made the money he was asking for.
Everyone else in baseball uses advanced stats, but the arbitration process seems to be 20+ years behind.
I mean that doesn’t sound like a bad idea. And I think people often do that, advocating for metrics that they think captures the value they offer.
Of course you can see the downside of just allowing anyone to justify their performance by whatever metric they choose. The biggest one that stands out to me is that letting employees justify their own performance will result in the most silver-tongued employees getting the biggest raises regardless of how much value they bring.
But on its surface it’s not crazy to expect that the people who know how their job works to provide better interpretations of the data (I also don’t think Pham accomplished that here)
Not sure how player “input” would work. Anyone who cares enough to do so can publish baseball research and if it’s compelling enough (like catch framing, or OAA) it could eventually make its way into some version of WAR, one of its components, or some other stat that exists outside of WAR entirely. Or, one step removed, anyone can raise concerns with any component of WAR that they think leads to inaccurate results, at which point those concerns, if valid, could be taken up by the sorts of people who do that sort of thing all the time, for fun and/or as their career, and that could lead to meaningful improvements and widespread adoption.
But in general, players aren’t data scientists. In 2018 Anthony Castrovince asked 35 MLBers to name the one offensive stat they cared about most for a piece on mlb.com. A majority chose meaningful stats (OPS and OBP were the most popular), but only barely. AVG, R, and RBI got a combined 9 votes
Love watching what these folks do on the field and they can be genuinely insightful, but on the whole, I’m going to stick with the data nerds over the ballplayers when it comes to improving our data-based understanding of the game.
Amusingly, Joc Pederson was one of the 3 votes for batting average, despite his career .222 BA and solid .780 OPS and 115 wRC+ at the time. Say what you want about the guy, but he definitely wasn’t trying to cherrypick stats just to make himself look good.
I wonder if he cares about BA so much precisely *because* he knows his is so anemic and he really wants to improve it.
1) Nothing is stopping any current or former players from reaching out to members of the sabermetric community to offer their insight or criticism. Some fun is being poked at Tommy Pham here, but I’d bet that any of the writers on this site would be thrilled to enter into a productive working partnership with a player truly committed to improving sabermetric evaluation tools.
2) Most (all?) teams have their own internal metrics anyway, so those here on Fangraphs or elsewhere in the Nerdosphere aren’t really informing their livelihoods.
The pre-arb bonus pool is literally based on a modified version of WAR, weighted heavily towards the version developed on this site.
It would not shock me if Scott Boras used Fangraphs on occasion when it helped his argument in favor of a player.
It would also not shock me if Boras used Fangraphs to light a bit of a fire under some of his players as well.
I got the sense reading Eno’s article that Pham thinks he is better than he actually is and will find any (nonsensical) proof to say he is better than his own numbers.
I always had a certain amount of grudging respect for Joe Morgan’s disdain for advanced stats. It definitely wasn’t self-serving!
It would be highly entertaining if someone takes his suggestions and somehow implements them and it turns out it makes him actually look worse.
Morgan the announcer seemed to hate the player he was, lol. I fondly remember Fire Joe Morgan and Ken Tremendous mocking him weekly in his columns.
That can’t be right… Mose doesn’t know how to use a phone.
It was ridiculous. He was hating on on-base percentage, simple WAR calculations, the stuff that was cutting edge 25 years ago.
Baseball is hard enough that being somewhat deluded about your own ability is probably a competitive advantage.
Not just in baseball! One of my colleagues works on questions like “Why should we care about having accurate beliefs?” and one of the reasons the question isn’t that easy to answer is that cognitive biases can be beneficial, especially the bias of attributing your successes to your own actions and your failures to anything else. Which is exactly what Davy is talking about at the end of the piece–the best statistics for you to believe in are ones that make you look good.
The funniest thing would be when Morgan would say things like “if people only cared about stats nobody would’ve given me a shot” – coming from a guy who looks even better in retrospect when you look at stats that matter instead of what’s on the back of baseball cards. There have been better stretches than what Morgan did from 1972-1976 but not many, and I’m not sure we’ll ever see anything like his 1975 season (BB% of 20.7, K% of 8.1) ever again.
You have to understand where Tommy Pham comes from. In addition to the general rough circumstances of his youth, two years into his pro career he was diagnosed with a degenerative eye disorder. It’s really hard to hit a baseball with a degenerative eye disorder!
This is a guy who has spent his entire career doing things that other people say he won’t be able to do. More than most players he has completely unrestrained faith in his own abilities and to overcome whatever is in front of him. He’s had this seemingly delusional view of his own abilities for a long time and it has worked out for him. Why would he stop now?
(I would also add that I do not *agree* with him here and also that he sounds like a miserable person to work with, there’s a downside to this as well)
Very nice. Effectively Wild covered some of this as well. I hope Pham sees this, as we know he has used the site (for instance, to clapback about his baserunning acumen).
Thought for sure AppleGraphs was going to be an homage to the Dark Overlord.
I couldn’t help but think of it as the Mark Appel version of PhamGraphs, though our poor former 1/1 pick probably had a shorter major league career than the entire span of the AppleGraphs experiment.
There is a website called “Apple Rankings” or something like that which is kind of like Notgraphs for apples.
I was sure this was a covert NotGraphs post, and then you came in with actual analysis and data on the backend.
FTR, I would have been 100% fine if it was just a covert NotGraphs post.
My wife is Vietnamese and she asked me if there are any Vietnamese in MLB, and Tommy Pham was the only one I could think of. Then I looked into it and, yep, he is it. I should edit that Phamgraphs graphic with her picture on it. For personal use only, of course.
Well that makes Pham the greatest ball player of not only a country but his entire nationality.
To be clear, he was born in Vegas and played for Team USA in the ’08 Olympics. His dad was born in Vietnam, hence the last name, but at least in baseball terms his nationality is generally considered American. It would be interesting to see if he would be enough to power a Team Vietnam to the WBC, though!
There aren’t that many Vietnamese-Americans and in Vietnam itself soccer is the most popular sport, I think by a lot. It’s not like Japan or Korea.
If the US had won the Vietnam war this probably would have been different but that is an alternate history so remote it is hard to believe it could have happened now.
Danny Graves!
How did 6 of the 10 guys that faced the toughest pitching end up being Rays? It’s not like the AL East was loaded with pitching with the other AL East teams finishing 5th, 14th, 19th and 26th in team ERA. Indeed, Narvaez was in the AL East and ended up facing the easiest pitching by ERA.
The easiest list has an NL East vibe to it with 3.5 Mets (Mullins was a mid-season trade) and Bohm. The NL East teams were 8th, 18th (Mets), 22nd, 25th and 29th so that checks out. OTOH, there were also 3 Reds and the other NL Central teams were 2nd, 7th, 9th and 21st so not sure how that checks out.
Gotta run so can’t check it out but I wonder if it is some sort of platoon/matchup thing. . .
This was certainly my first thought in Pham’s case. He’s exactly the kind of guy who sees opposing bullpens working hard to have the platoon advantage in late innings.
Great writing, Davy. Hilarious!
Well, good sir, I am decidedly not a venture capitalist and do not have a million dollars to throw your way. But I am a banker, Blue Jays fan, and gala apple enthusiast, and I would throw 10 dollars a month at a prospective AppleGraphs resurrection.
Anyone who did not immediately click over and read AppleGraphs, I am hereby mocking you for thinking that you have something better to do. Did you really?
Thoughts:
I am told that it is really important to eat McIntoshes in season, and that the season starts in late summer. So a late July McIntosh might have been too early. I might be trying to defend the honor of Vermont, but I’m also told that much as we identify with the apple, Vermont is not a great climate for growing apples, and that our apple orchards persist only through various trickeries. As you can tell by all the passive voice, none of this is definitive.
I was surprised by your criticism of grapes and orange segments as just eating juice. While I love an apple and prefer it to oranges, the way oranges supply their own little juice packets has always appealed to me. More so pomegranates. With pomegranates I’m like “I can see why this might be worth spending half the year in Hell.” Then again I lived in Lubbock for two years, and don’t remember getting a pomegranate out of it.
The older gentleman next to you probably was not seventy percent water! I have read recently that humans become progressively less watery as we age. Somewhat like apples.
“Spending half the year in hell” is how I think of disassembling a pomegranate for consumption.
“Spending half the year in hell” is how I think about two weeks in Lubbock
Pham just needs to try harder to make Phamtastic plays!
Waiting on the edge of my seat for Not Phamgraphs
That’s every article about Joc Pederson or Luke Voit.
Since your early AppleGraphs tm days, the Cosmic Crisp has ascended to the MVP level in the apple kingdom. You really owe all of us a dedicated entry on the new GOAT of apple varieties!
I used to be a big Pink Lady fan. I still like them, but you are 100% correct on the Cosmic Crisp.
Yes. I haven’t gotten the chance to check the list yet, but the seasonally available Opal also ranks highly.
Someone is getting so slapped the next time Pham sees him.
MLB players are fair game. I bet he gets ribbed in the dugout then laughs it off. But, i also bet Scott Borus asked him about his defensive numbers on Fangraphs and got him thinking.
Great article. A real notgraphs and phamgraphs hybrid. But applerankings has you beat on the fruit front. 🙂
There were no graphs, but I made a guessing game of Apple vs Strip Club because apple names have gotten well out of hand lately.
The versatile and tart Pink Lady is probably both tbh
tremendous stuff. i cackled.
is Carson Cistulli resurrected from the dead as Davy Andrews?
I mean, it was Eno who did BeerGraphs!
I really enjoyed it. The in-depth research was interesting and impressive and the lighthearted tone made it an enjoyable, easy read. More like this, please!
I am surprised by what I take as dismissiveness about the first point due to the claim that the marginal differences are small. Fangraphs has made marginal improvements to it’s own stats over the years, and has added new stats to the site that show only marginal differences from existing stats. Improvements to Zips are commonly quite marginal, if my memory serves. When I see 95 v 98 wrc+, I think that is a pretty big difference for an otherwise minor change. Baseball is about the littlest margins. That doesn’t mean that Pham is right about this point or that changes should be made. The discussion about how to measure pitchers quality and apply leverage is relevant. But the idea that a proposed improvement is without value because the improvement would be small seems off the mark.
Pham had no criticism of this site in the halcyon days of 2018 when he was compared to Christian Yelich! What changed?
I do think there is something to the point about a hitter in a bad lineup facing tougher pitching than a hitter in a good lineup. Along with seeing a closer more often and a mop up guy less, fewer at bats for a team means lower opposing pitch counts and lower odds of seeing a starter for a third or fourth at bat. The difference between the best and worst lineups averages out to around 2 PAs per game and 6% more PAs so it’s not a huge difference, but a bad lineup might see better pitches on average from the same pitcher relative to a good one. League wide, hitters had a 104 wrc+ with runners on base and 96 wrc+ with bases empty so that would be a factor as well.
I’d be interested to see if there’s a bigger difference in the quality of pitching faced by hitter if it’s measured by a process stat like Sarris’ pitching+ than the minor differences in season long ERA and FIP covered in the article.
I think it nudges Pham slightly closer to 100 wrc+ and it’s something to consider with hitters in weak lineups in general.
Be careful Davy, Pham has slapped folks for less.
Something interesting/weird about that first chart — Toughest and Easiest Pitchers Faced in 2025 — six of the ten players who faced the lowest average ERAs were Rays players.
I don’t know what that means, if anything, but it’s interesting.
I think the real lesson here is – all else being equal (replacement level), it’s always better to be the guy who isn’t an @$$#Ø£Σ.