
Well, the Orioles Are Doing it Again
The other day, I wrote that the Yankees have so far been the best team in baseball. I stand by that, in that nothing has changed in the limited time since, but there’s one measure where the Yankees are no longer on top. It’s the simplest and also most meaningful of all measures — win-loss record. The Yankees are an excellent 21-10. The Orioles are a slightly more excellent 22-10. Powered by a six-game winning streak, now it’s the Orioles who have baseball’s best record, and, well, to get into this, we’re going to need to get into some background.
For many of you, this is going to be an unnecessary review, but for the past several years, the Orioles and the numbers haven’t exactly gotten along. There are a few ways I can demonstrate this. For one, here’s a plot of the difference between actual team wins and preseason projected team wins, from between 2012 and 2016.

That particular time window is arbitrary, I know. It makes the Orioles look the most extreme. In 2011, 2010, and 2009, the Orioles dramatically under-performed the preseason projections. But, things change, and regardless of how arbitrary the time window might be, this is pretty huge. The Orioles have beat their projections by 58 wins. The team in second place is at +35. Good for the Pirates! Good for the Royals and Cardinals! But the Orioles have gone absolutely insane. This isn’t a secret; this is part of the narrative. This might be the *foundation* of the narrative. The projections don’t understand the Orioles. Whether that’s actually true, I can’t say, but there’s evidence, is the point.
It’s not just that some Orioles have done better than expected. It’s also been a matter of timing. This, again, is probably review. But there’s over-performing, and there’s over-performing even your own team statistics. We keep track of a team’s BaseRuns record, which is an attempt to assign an expected record based on team performance, independent of sequencing of events. That sentence isn’t a fun one to read or write. Let’s just look at a second plot.
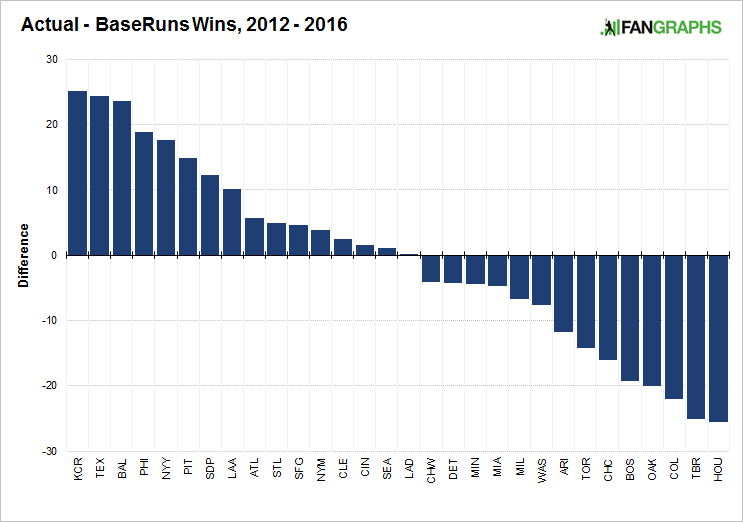
The Orioles aren’t the most extreme, but they’ve still stood out from most of the pack. They’ve exceeded their own statistics, on the team level, joining popular number-defiers Kansas City and Texas. As one more way to show similar data, here is a simple plot of team winning percentage against team OPS differential. The Orioles are in orange.

Over the five years, the Orioles ranked fourth in baseball in winning percentage. They ranked 14th in baseball in OPS differential. You wouldn’t think the two would be so far apart. Hence, how the Orioles and how Orioles fans have regarded the advanced statistics. Who could blame them?
That seems like enough background. What’s been going on in 2017? I’ll construct the same plot with updated numbers, and — oh. I see.
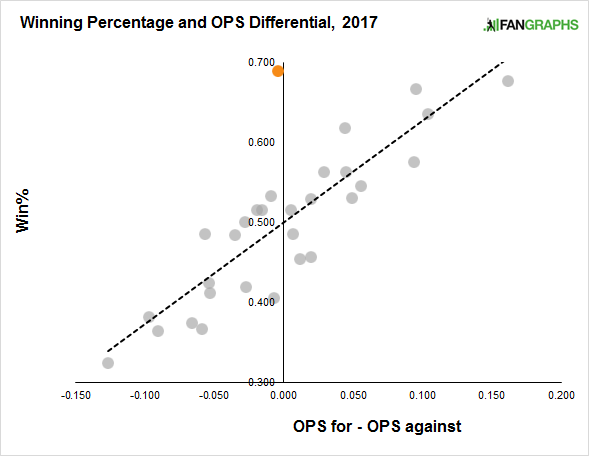
For the most part, things look normal. Even over a small sample of the season, most teams are hanging around the best-fit line. And then there’s the Orioles, who are laughably exceptional. By winning percentage, the Orioles rank first. Nobody better. By OPS differential, which almost couldn’t be simpler, the Orioles rank 15th. 14 teams better, including the A’s and the Rays. If you just looked at the Orioles on paper, you wouldn’t see a team worth talking about. The team’s winning. BaseRuns has noticed.

The Orioles’ BaseRuns record gives them an equal number of wins and losses. They’ve exceeded that by six wins, which is three wins more than any other team. Forget what this would put the Orioles on pace for; obviously, that couldn’t sustain. That doesn’t mean this isn’t crazy. And, oh, by the way, even that .503 BaseRuns winning percentage — on opening day, the Orioles were projected for a .492 winning percentage. So they’ve kind of over-performed while they’ve over-performed.
This has very little to do with the offense. The hitters have collectively been normal, basically, and their timing has been all right. Between 2012 – 2016, Orioles pitchers had baseball’s best timing. Overall, they ranked 20th in baseball in OPS allowed. However, they ranked fourth in OPS allowed in high-leverage situations. This season, they rank 11th in OPS allowed, and seventh in OPS allowed in high-leverage situations. Maybe more importantly, they rank 27th in OPS allowed in low-leverage situations. When the Orioles have given up runs, they haven’t mattered much, relatively speaking. As the stakes have gotten higher, the Orioles have gotten better.
It’s more of the same. This is the Orioles’ recipe, and it has ever so much to do with Buck Showalter and how he handles their bullpen. The Orioles bullpen has been by far the biggest reason why the team has so dramatically over-performed in the last half-decade. What makes things extra funny is that the Orioles bullpen is presently without the injured Zach Britton, who’s one of the most valuable relievers in the sport. Darren O’Day has an ERA north of 5. Things haven’t gone quite as the Orioles wanted, but the bullpen is still No. 3 in baseball in Win Probability Added. It was No. 1 over the previous five years combined. Throw in some unexpected quality work from the rotation and you’ve got a 22-10 record.
This is the part where I follow the template. Extreme data points can’t continue, regression is inevitable, wins are already in the bank, etc. It’s all pretty much true, and it’s all perfectly boring, and you already understand it perfectly well. I’m not sitting here attempting to call out the Orioles or anything. It’s more just a declaration of amazement. It would be interesting if it were any team starting how the Orioles have started. The fact that it’s them, specifically them — even if it is just random chance, what were the chances it would be Baltimore who’d sprint out like this? This is why Orioles people don’t put too much stock in what analysts have to say about their ballclub. It’s perfectly natural for analysts to be defensive in response, but, who could blame either behavior? From a statistical perspective, the Orioles have been uniquely bizarre. They’re doing it again. You have to be able to appreciate this.
Jeff made Lookout Landing a thing, but he does not still write there about the Mariners. He does write here, sometimes about the Mariners, but usually not.
Similar to their 96-win squad in 2014, what’s especially interesting about the 2017 Orioles is how little they’ve gotten from the best players on the team so far. Manny Machado and Chris Davis are hitting like average players, not superstars, Mark Trumbo only has 3 HR, Zach Britton is hurt, Kevin Gausman is bad and Chris Tillman (the staff’s putative “ace”) has barely pitched at all.
Not only are they beating expectations, they’re beating expectations in a very improbable way.
That is a great point. If you had told me before the year that Baltimore was starting 22-10, I would have assumed Davis hitting like it’s 2013 &/or Machado turning into Mike Trout &/or a Trumbo 1st half 2016 repeat.
& when those guys start playing better (& they get Britton back), it will offset some of the regression they are likely to see in the high leverage pitching #’s.
Alternately: If those guys don’t start playing better, they will regress. I don’t know if I believe that will happen, but it is a possibility. Of course, saying that means you’ll wind up on the “haters quote board” somewhere in the O’s clubhouse.
No, it is possible. Let’s say Britton’s arm keeps bothering this season; then we’ve lost one of the best closers in the game. Brach is good, but he’s no Britton.
And there’s always the possibility that Bundy (or Tillman) get hurt again. Who do they have in their farm system to take their place? Nobody. (Unless you think Wright or Wilson are major league caliber players, which IMO they aren’t.)
They’re always a worst case scenario for every team, and the Orioles are no exception—though I hope as an O’s fan it doesn’t happen because time is running out for this team to stay a playoff caliber team.
They have already employed 2 late-spring additions that have leapfrogged the mediocre “W” Brothers. Introduce yourselves to Gabriel Ynoa and Alec Asher, castoffs from the ‘pitching-rich’ Mets and and Phillies, respectively. I watched their spot starts while things were going pear-shaped with Tillman and Gausman. Far above and beyond all my modest expectations!
Once again, Trader Dan shows his very unkempt version of Class.
Have Asher and Ynoa looked good so far? I can’t tell because we don’t have cable anymore and the guy at mlb.tv misinformed me when he said I could watch the O’s (and the Nats) on the road, so I cancelled my subscription.
Agreed. Meanwhile just about everyone on the Yankees is outperforming expectations. This is like the NBA or NFL game where in the first half one team seems to be playing out of its mind, you look up, and see that they are only up by a few points at the half. Normally the second half is their comeuppance.
Dave’s anger intensifies…
Dan Duquette seems like a guy that knows how to use stats. He’s had success everywhere he’s been. Even if he’s not the most stats-oriented guy, he’s clearly got some secret sauce.
I’d also add that 2012 isn’t entirely arbitrary, since that is Duquette’s first year.
Zero pennants in 18 years as a GM — most of which were with above-average payrolls. Doesn’t mean he’s not good, but it does suggest he lacks a magical secret sauce.
The Orioles have been dysfunctional for so long. They still sort of are, but I think that Duquette’s most amazing characteristic is keeping that under control. I don’t know how much of the team’s success we can attribute to that versus “secret sauce” stats but that’s my guess.
A puzzle- the Oriole’s ERA is half a run lower than the FIP and almost a run lower than the xFIP in 2017, but the team defence is according to UZR -4 and DRS 0. Is the difference between ERA and FIP due only to sequencing, or is it also that the measures of defence have a wide error bar?
When I looked at the 2012-17 period, this was not an issue. Defence fairly rated explained the difference.
FIP ignores defense completely (it only accounts for K, BB, and HR), so the difference in ERA and FIP comes down to some combination of sequencing and batted ball fortune, which would include defense.
Here’s the formula:
http://www.fangraphs.com/library/pitching/fip/
The Orioles’ recent track record of ERA outperforming their FIP is all the more curious given that 1) FIP isn’t park adjusted, and OPACY is a nice place to hit dingers and 2) the Os’ have rolled with a bunch of guys for whom defense isn’t their calling card (outside of Machado, of course).
Hardy and Schoop are excellent up the middle.
I will definitely grant you Hardy (my comment was too general, wow Hardy has nice numbers), but Schoop’s been an average defender by both UZR and DRS:
http://www.fangraphs.com/statss.aspx?playerid=11265&position=2B#fieldingadvanced
The theory on Schoop is that the metrics don’t capture a lot of his true value on defense since they don’t take positioning into account. Schoop plays unusually deep for a 2B which allows his arm to make up for his more limited range and, I’d argue, makes him a much more effective fielder than DRS indicates.
Question: If FIP isn’t park adjusted, what is the advantage of using FIP over FIP-? Just curious.
That’s not entirely true. Our outfield defense may be lacking, but our infield defense is excellent. Hardy and Schoop make a great DP combination. Machado is probably the best defensive 3B in the game, and Davis has greatly improved his defense since his first couple of years with the O’s.
And if Joseph hits—like he has for the last week—then our infield defense is even better since he’s a great defensive catcher and pitch framer.
I wrote far too broadly. I was thinking of the outfield (corners in particular with folks like Trumbo). Even with that, it’s still quite impressive how much the O’s have outperformed their FIP.
Also, really on the downvotes? I wasn’t hating on the Orioles, just making an observation that the disparity between ERA and FIP was hard to explain.
nt
The part of their bullpen management that gets less attention outside of Baltimore is the way they rotate long reliever/fifth spot starters between Baltimore and Norfolk. Duquette went dumpster diving this year and came up with a few (so far) gems. Ynoa, Verrett, Asher have all pitched very well in those roles. They try this every year but what’s different in 2017 so far is that these pitchers in those roles are much better than who they had in prior years, and are more flexible to use because they all have options. Maybe the Orioles’ unfair advantage is they use more players!
Yup, I read an article the other day, and the Os have used far more pitchers than anyone in the AL East, I think Duquette is on to something, even when Jimenez and Gausman pitch a complete stinker the pen is still fresh cause of the long guys they are shuffling back and forth from Norfolk.
Yep. That’s something he’s been doing for years. Look at Logan Verrett. He’s pitched well in his last two appearances, but he’s off to Norfolk again.
Exactly – people talk about whether they should go with a 4 man bench and a 7 man bullpen or have a 5 man bench, which they do, and a 6 man bullpen. The truth is they keep and utilize heavily the 5 man bench and still have a 9 man bullpen, but they just keep 3 of those 9 in Norfolk at any given time and make sure they always have fresh arms available. Verrett has been in two games and given them excellent outings leading to improbable extra inning wins both times, and in both cases he was optioned the next day.
The Yankees do this as well, to some degree.
One of the things that allows them to do this is Norfolk’s (relative) proximity to their home park. I think teams that have faraway AAA affiliates (the Mets, Nats, White Sox, Rockies, Brewers, Padres, Astros, A’s, Marlins, Dodgers, D-backs, Angels and Rays all have AAA affiliates out of driving distance) should investigate moving them somewhere within driving distance of the home park for the purposes of making shuttling players less onerous on the players. I don’t know what good calling up a fresh arm does if they’re jet lagged when they arrive.
Buck Showalter is mentioned, and given some credit, but even the best projection analysis cannot quantify the contribution that this man makes to the success of the Orioles. In the game, as it is evolving, the bullpen is more and more the determining factor in the outcome. Throughout this run in which the Orioles have made the projections look foolish his handling of the bullpen has been nothing short of true genius.
* Except for Oct 4, 2016
I sure hope he doesn’t have to live with that, he already has being the guy before championships in New York and Arizona.
I will take his record in the 1044 regular season games with the Orioles while acknowledging that it probably wasn’t his best moment to have Ubaldo Jimenez, of all the stiffs in the world, in the 11th inning of that game.
Me too. Before you even get to the playoffs, you have to figure out how to win during a long 162 game season.
This is the irony about saying the O’s are on this run bc of bullpen.
Please try to justify his failure to use Kim in painfully obvious situations this season. (Late in close games with a RHP on the mound).
Great post Jeff!
Yeah it was great to see someone at FG acknowledge this, but the piece doesn’t seem to go to far in trying to explain this 5+ year run in the face of the expectations in certain corners of the sport’s ivory tower.
based on these graphs, it looks like the Rays are also doing IT again..under performing
So the O’s are the opposites of the A’s? Got it.
“This is the Orioles’ recipe, and it has ever so much to do with Buck Showalter and how he handles their bullpen.”
Nothing in the article supports this hypothesis. If you can show that he actually uses RPs in such a way to create this leverage/performance correlation, great. Otherwise, it’s prob. variance plus some specific pitcher skills (to perform better in close games).
I.e., take a look at leverage splits by individual pitcher. If that’s most of the explanation, it has nothing to do with Showalter — unless he can somehow coach pitchers to be clutch.
i agree, im not sure i buy the ‘buck amazing bullpen management’ theory of why the orioles are outperforming baseruns every year…
i mean do we really think that hes some sort of managerial genius thats using his bullpen in a way that no other manager in baseball has ever figured out? idk just seems a little hard to believe.
scioscia got a lot of credit when the angels were outperforming baseruns for a large stretch until it ended. then it was the royals baserunning, defense and bullpen (and ofc grit, hustle and TWTW) responsible for their outperforming until that just stopped also. its possible we’re looking for something that doesnt exist.
For five plus years running? I’m a little skeptical of the notion that Showalter has nothing to do with it. After all, he’s the only manager to win MOY awards with three different teams. He clearly knows how to manage.
well like i said scioscia and the angels did it for a long period too.
buck is clearly a good manager, nobody would argue that i dont think. but to think hes using some voodoo bullpen magic to drastically outperform projections/baseruns/pythag in a manner that apparently nobody else in the history of baseball has ever figured out is just a little hard for me to believe. i havent looked into this but have the other teams hes managed outperformed in this manner?
this is the type of thing that can just happen seemingly at random for multiple years at a time, though i do agree that there may very well be something here. but to just look at everything thats happened and be like ‘yup thats all buck’ bc we have no current statistical explanation doesnt seem like right way to go about it.
also lol @ MOY awards.
Does this result indicate a failing of BaseRuns? From Jeff’s other article today:
“BaseRuns is a more reliable measure than actual small-sample performance”.
In other words, as the time scale increases, wouldn’t “Actual-BaseRuns” approach zero? Why such a large number over a five year span? Is BaseRuns itself not performing as we’d expect?
How does, “BaseRuns is a more reliable measure than actual small-sample performance,” imply that Actual-Baseruns will converge to zero?
Outliers exist. It’s still totally possible the Orioles have just been a long-term low probability fluke.
I think something that gets overlooked when discussing the projections for the Os is how many truly awful SPs they have had in their rotation over the years. When Ubaldo Jimenez comes out and gives up 7 ER in 2 innings, that’s going to hurt their run differential a lot. But that’s just one game and they are likely to win the close ones with the bullpen they have had.
I would be interested to see if Baltimore has substantially more blowout loses than normal and whether that has been an abnormal portion of their loses over the years. It would be interesting to see how that has affected projections.
Wade Miley is going to come crashing back to Earth soon and it won’t be pretty. His BB% is 14.7% (7.6% for his career) his K% is 27.6% (18.8% for his career) and his LOB% is an absurd 89.9%
Dave Cameron laid out in 2014 why this was probably just random variation:
http://www.fangraphs.com/blogs/the-orioles-and-accepting-random-variation/
We now have 2.25 more years of seemingly less than random variation. At what point do we think something is actually going on here?
Never. Unless there is some factor that is identified as influencing the actual results.
The fact that the results are unexpected over a period of time merit an examination of the factors involved, but if no factor is identified…well, they just happened to win a coin toss 10 times in a row.
Nassim Taleb talks about this. You flip a coin and it lands on heads 99 times, what are the odds it’s heads on the 100th flip? Naive people will say “50%” but the savvier approach is to conclude the assumption of a fair coin must have been incorrect.
Sure, but that’s not the relative comparison here. A coin flip landing on heads 99 times is practically impossible to observe (even 10 times in a row is ~00.1% likely).
In a overly simple statement, the Orioles beat projections – something they’re mathematically likely to do about 50% of the time – 4 years in a row. That’s really impressive. It happens about 6% of the time. It’s very fair to claim as a Bayesian that you should start updating to believe that the Orioles are more likely than 50% to beat their expectations.
The more complex answer statement would require knowledge of the magnitudes of their differences from projections. If they’re absolutely crushing them years, you should be more likely to update. If they’re outperforming them by a single game, probably take a more conservative approach.
Personally I’m fine granting that the Orioles could have a factor that has them outperforming their expectations consistently. On one hand I wish more was written on that. On the other hand, this article does explore it, and has a an explanation (that itself could use more research) that sequencing carries the weight.
If the team that was doing this was the Athletics, Dodgers, Red Sox or Cubs would the narrative would be that the GM and/or manager is brilliant and ahead of his peers?
This article sort of goes in that direction, but it would be nice to see this team lauded in the way that some of the aforementioned have been.
Main difference between the Orioles and Yankees is the Yankees have had pretty much everything going right and are poised for regression. I know Sanchez snd Didi were hurt but they got great performances from Romine and Torreyes. Orioles have yet to click offensively and their bullpen has had issues w/o Britton. Their SP has been helped by Bundy and Miley, and with Tillman now back they could be a decent rotation if its real. However, they probably are due for regression there. Jiminez is awful but then so hasn’t CC been (one of the few disappointments for Yankees)
“everything going right.”
Sabathia turned back into a pumpkin. Romine was good, but Higashioka didn’t get a hit at all while serving as backup, so that almost ended up being a scratch. Bird was playing hurt, so because of that was bad. Carter hasn’t hit homers. If Carter doesn’t hit homers, he isn’t any good. Tanaka wasn’t that good to start the season.
As for overperformance, while Hicks has been hot, he still hasn’t quite had enough playing time given his hotness. Castro hasn’t been the player he’s been since his early days with the Cubs, but he has also shown improvement in his walk rate this year. Judge has been too hot, okay, but the projections also didn’t know that he could make the adjustment that he has made; he’s an above-average offensive performer who is also an above-average fielder. And yeah, Torreyes has been nice but the Yankees have had to embrace depth during these years of decline with their superstar players in part because of the fragility of aging stars. That’s why teams like the Giants and Padres are running players out there every day that we brought up to use in backup roles or to fill in for injured stars, like Solarte or Nunez.
The Yankees pitching staff is at least average just about every year. It’s when their offense is above average that they make the postseason. This current roster–while dependent upon Sanchez to avoid a sophomore slump, Judge to avoid being unable to adjust to pitchers’ adjustments to him, and Holliday’s ability to be both good and healthy–is deep and competent. It isn’t a world-beater, but there are probably not the sort of holes in this offense that there have been in (non-postseason) years past.
As for the staff, Tanaka is an ace, Severino has taken the step forward that people think he might do (listen to Pedro Martinez talk about Severino), Pineda has seemingly solved his two-strike and two-out issues, and Montgomery is very competent.
There’s very good reason to believe that (ignoring health) this is a top 5 American League team. There’s also good reason to believe that health won’t be the issue it has been in years past (though the Yankees haven’t have Mets-caliber health issues) because the roster is no longer reliant upon mid-to-late-30s and 40something former all-stars.