What Happened to Zack Greinke’s Strikeouts?
Through 18 starts and 111.1 innings pitched, Zack Greinke has compiled a 3.64 ERA. To say those figures play at the top of a major league starting rotation would be an understatement. The mere fact that Greinke remains a good pitcher at the age of 37 in his 18th season is an accomplishment in itself. Arriving in Kansas City as a 20-year-old, just two years after being drafted sixth overall out of high school, Greinke has put together quite the career, accumulating 64.2 WAR (which ranks 42nd all-time and third among active players), winning a Cy Young Award in 2009, and finishing in the top-10 of Cy Young voting on four other occasions (’13, ’14, ’15, and ’17). His Cy Young campaign was 12 years ago and he is still an important cog on a club with World Series aspirations, a testament to Greinke’s greatness and longevity. And that’s to say nothing of what he has battled to become and remain one of the best pitchers in the sport for over a decade.
I prefaced this piece with a brief rundown of Greinke’s amazing career because I am going to be throwing up some red flags in regards to his performance thus far. Despite the excellent ERA I referenced to start, his strikeout rate is down to 18.5% (league average is 23.8%) after posting a rate of 24.5% in 2020 and 23.7% from when he signed in Arizona in 2016 through last season. His walk rate is up to 5%, still almost half the league average of about 9% but an increase compared to his 3.7% and 3.3% walk rates in 2019 and ’20, respectively. Greinke is inducing fewer groundballs than in any season since his Cy Young Award-winning 2009. From 2010-19, he allowed a groundball rate of 46.8%. In 2020, that plummeted to 41.2% and this year he is down to 40.9%. That means 59.1% of the contact he has allowed has been in the air. He has maintained his ERA with the help of a below-average HR/FB ratio and a HR/9 rate about 9% less than the rest of the league. His FIP remains at a solid 4.07, buoyed by his aforementioned home run fortune. Regress that HR/FB ratio towards league average and you get an xFIP of 4.14. Put a little more emphasis on his strikeout struggles and the types of batted balls allowed and you get a SIERA of 4.39, which is a tad less than 8% worse than league average.
So what gives? In his last four seasons, aging curve be damned, he has thrown 3.68 SIERA ball over a not insignificant sample of 685.2 innings, which placed him third in the majors behind only Jacob deGrom (690.1) and Gerrit Cole (688.2). Obviously Greinke is at the point in his career where we expect degradation in his performance, but this dip in his peripherals seems noteworthy given all his success, both in terms of surface-level numbers and those under-the-hood, in recent vintage.
The impetus for this downturn seems to be due primarily to his lack of strikeouts. In the past, he has paired a strikeout rate above league average with an elite walk rate and has been extremely effective at keeping batters off the basepaths. The first place I always look when analyzing a marked change in performance is the pitch mix. Greinke’s pitch usage has been remarkably consistent going all the way back to 2015:
| Season | CH | CU | EP | FF | SI | SL |
|---|---|---|---|---|---|---|
| 2015 | 18.2 | 9.0 | 0.1 | 43.7 | 9.9 | 19.1 |
| 2016 | 17.8 | 10.4 | 0.0 | 40.9 | 10.1 | 20.7 |
| 2017 | 16.0 | 12.9 | 0.7 | 38.9 | 9.0 | 22.5 |
| 2018 | 20.5 | 10.9 | 2.5 | 43.1 | 5.7 | 17.3 |
| 2019 | 22.0 | 14.7 | 0.9 | 41.0 | 5.3 | 16.1 |
| 2020 | 23.3 | 16.1 | 0.2 | 43.3 | 0.0 | 17.0 |
| 2021 | 22.3 | 18.7 | 0.1 | 40.8 | 6.8 | 11.2 |
The sinker has made a return this year and his usage of the eephus has waned, though I will point out that I believe there is some classification uncertainty when parsing whether a Greinke pitch is an eephus or a slow curve. His average curveball speed sits at just 71 mph and as I pointed out in my research on pitches under 70 mph, Greinke is one of the preeminent practitioners of “slowing it down” in the Statcast era. Many of those pitches are classified as curveballs. If you filter by pitches less than 70 mph, Greinke’s deployment of these moonballs is actually in line with the past few seasons.
| Season | Slow Pitch% |
|---|---|
| 2015 | 0.0 |
| 2016 | 0.0 |
| 2017 | 0.9 |
| 2018 | 6.5 |
| 2019 | 6.8 |
| 2020 | 6.4 |
| 2021 | 5.5 |
The effectiveness of these pitches has not been there for Greinke, however. From 2015-20, he was able to induce swinging strikes on 17% of pitches under 70 mph; this season he has only been able to do it 11.7% of the time. These extraordinarily slow pitches have not been the panacea for Greinke that they have been in the past. How have the rest of his pitches faired?
| Player | Pitch Type | Velo (mph) | X-Move (in) | Z-Move (in) | Swing% | Zone% | SwStr% |
|---|---|---|---|---|---|---|---|
| Greinke | CH | 86.4 | -12.5 | 4.6 | 52.3 | 25.2 | 15.3 |
| League Average RHP | CH | 85.5 | -14.0 | 6.3 | 51.1 | 40.6 | 15.2 |
| Greinke | CU | 70.9 | 11.5 | -10.6 | 51.3 | 52.3 | 14.1 |
| League Average RHP | CU | 79.3 | 9.8 | -9.5 | 39.4 | 42.9 | 12.5 |
| Greinke | FF | 88.9 | -1.1 | 16.3 | 41.2 | 58.9 | 5.1 |
| League Average RHP | FF | 94.0 | -7.1 | 16.2 | 47.8 | 54.4 | 10.9 |
| Greinke | SI | 89.6 | -13.0 | 11.3 | 37.5 | 40.2 | 5.4 |
| League Average RHP | SI | 93.3 | -15.0 | 9.4 | 45.3 | 53.4 | 7.0 |
| Greinke | SL | 83.1 | 8.2 | 1.6 | 53.3 | 34.8 | 18.5 |
| League Average RHP | SL | 84.9 | 6.1 | 1.8 | 48.2 | 44.7 | 16.9 |
The changeup has standard physical characteristics in a vacuum. It has always played well due to how similar it looks in shape and velocity to the four-seamer, with the measured spin axes only 1:00 apart, per Baseball Savant, while the movement is 2:15 apart. Greinke garners league average swings and swings-and-misses on his changeup despite only throwing it in the zone 25.2% of the time. The heat map for his changeup is a thing of beauty.
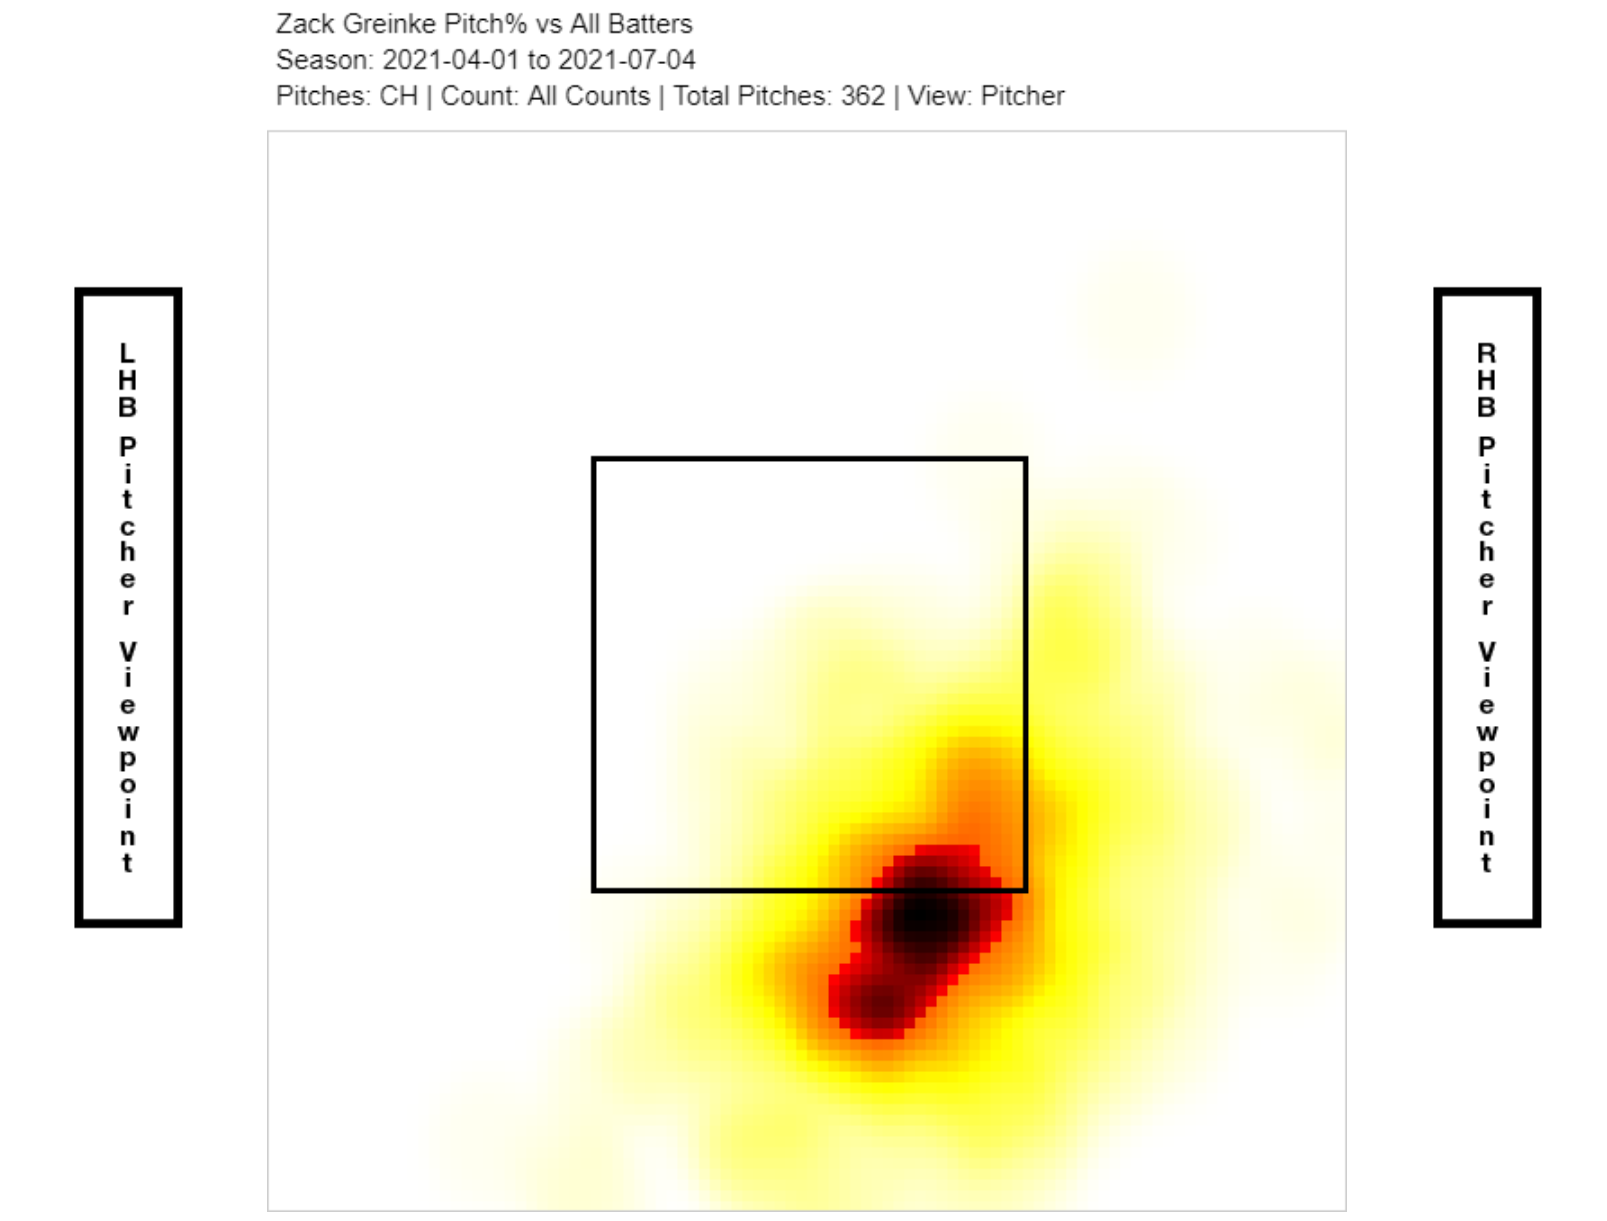
He might not be racking up whiffs with the pitch at an elite rate but getting hitters to swing so often despite not living in the zone has enabled him to induce weak contact with in terms of exit velocity (84.6 mph average exit velocity against) and batted ball trajectory (a -6 degree average launch angle).
Greinke runs a similar gambit with his slider (but on the other side of the plate), despite ordinary horizontal and vertical movement.
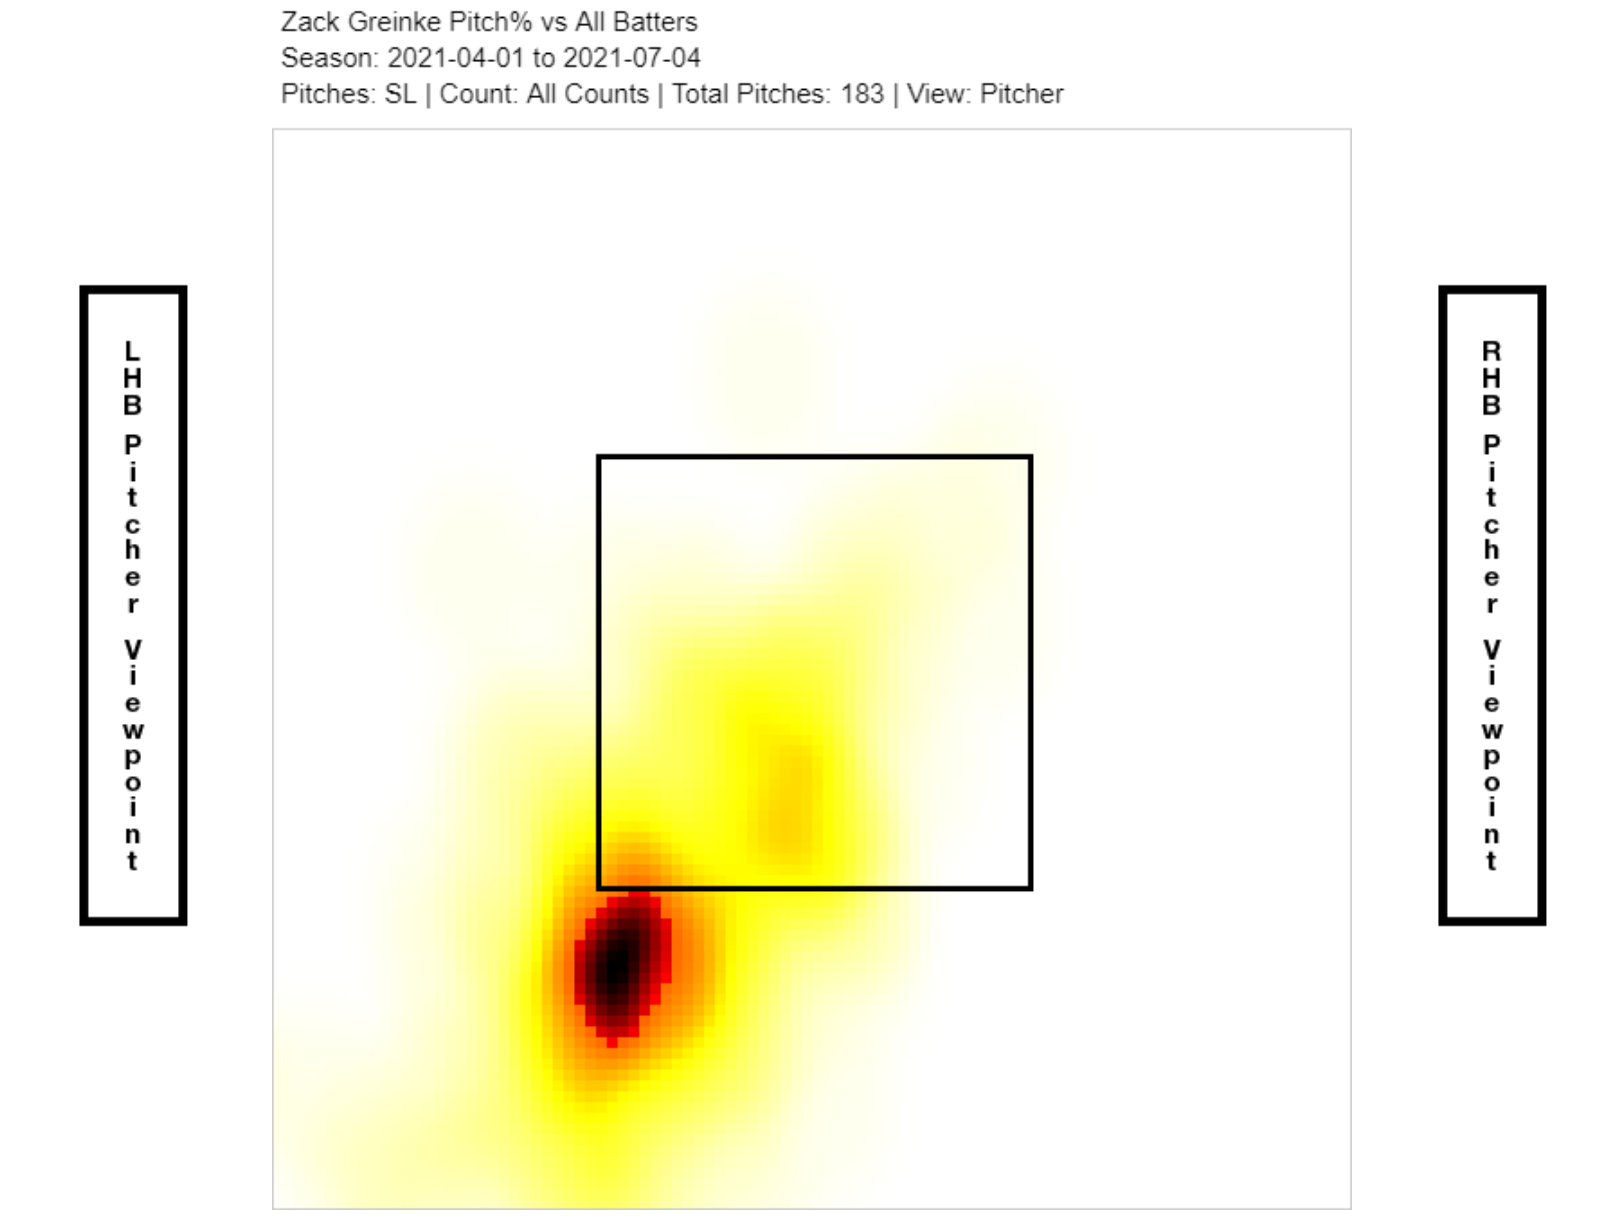
He does a good job generating whiffs (about one and a half percentage points above the league average) without having to throw the ball in the zone (10 percentage points below league average for sliders). Greinke can spot his notably slow curveballs in the zone consistently with a zone rate of 52.3% (compared to 42.9% for the league) and still provoke swings-and-misses at a healthy rate. And though he uses the sinker sparingly, after not using it at all in 2020, it is a mundane pitch with results and movement in line with his peers.
As you may have been able to surmise, Greinke’s secondary pitches have actually been effective this year, which surprised me given his lack of strikeouts. He consistently gets batters to whiff better than average or mitigate the quality of their contact. Even as he has aged, Greinke’s swinging strike rates for his changeup, curveball, and slider have been fairly consistent and generally better than average.
| Season | CH | CU | SL |
|---|---|---|---|
| 2015 | 19.2 | 4.5 | 21.6 |
| 2016 | 16.2 | 9.3 | 21.3 |
| 2017 | 18.2 | 14.5 | 26.1 |
| 2018 | 18.0 | 14.6 | 18.2 |
| 2019 | 15.1 | 17.8 | 13.6 |
| 2020 | 26.2 | 12.4 | 10.0 |
| 2021 | 15.3 | 14.1 | 18.5 |
For context, for all pitchers (including left-handers) in the Statcast era, the average swinging strike rates for changeups, curveballs, and sliders are 15.9%, 13.0%, and 17.0%, respectively. More often than not, Greinke has exceeded those marks, though his slider has lost some bite as his velocity has declined with age.
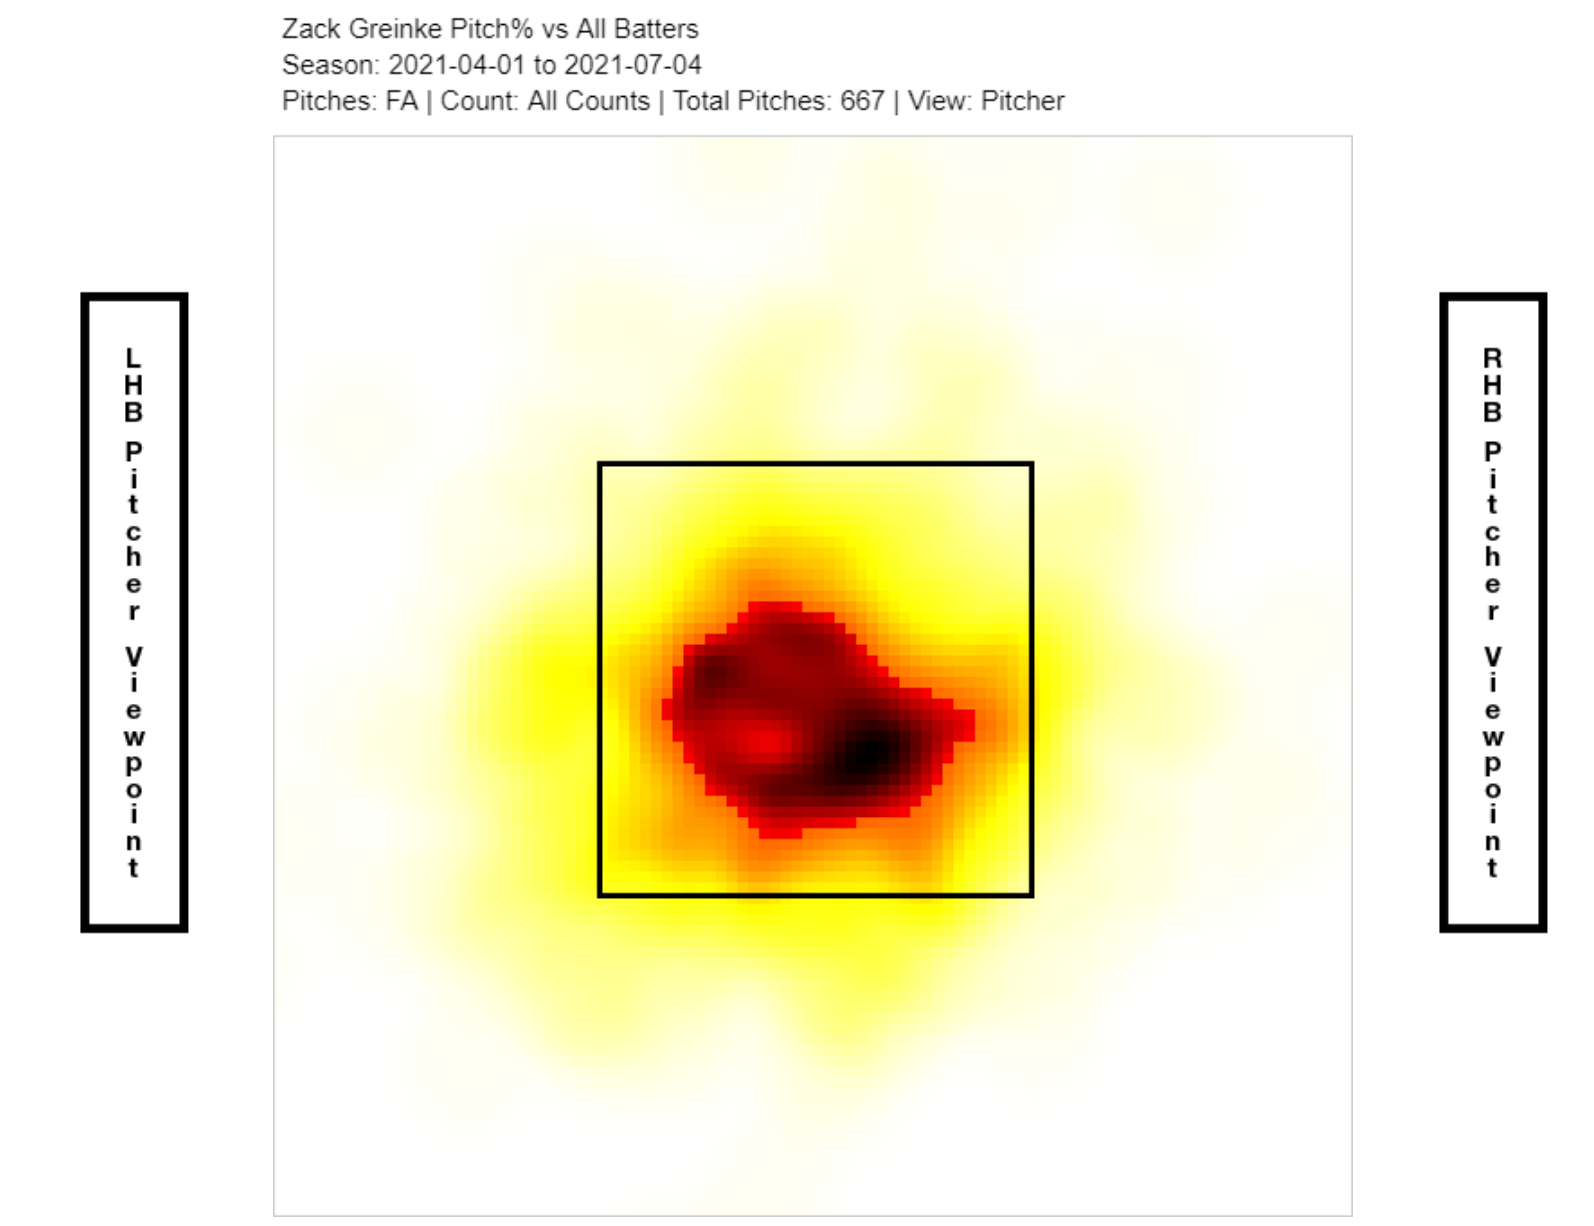
I still have not addressed one of Greinke’s pitches and given that it is his most-used pitch, that might be making you tear your hair out. Greinke utilizes his four-seam fastball about two of every five pitches and it has been a major issue for him this year. The fastball shows well below average velocity, very little horizontal movement, and average ride despite the lack of velocity. This is an indication that he throws the pitch with near-perfect backspin. Despite placing the four-seamer in the zone almost 60% of the time, opposing batters only swing at 41.2% of the offerings. This is part of the reason Greinke has just a 5.1% swinging strike rate with the pitch, less than half of the rest of the right-handed crop in the majors. But even in terms of whiffs per swing, Greinke’s 11.7% rate is still about half his peers.
The shape of the four-seamer is not the issue; as I alluded to, it displays very good vertical break in the context of the speed with which Greinke throws it. I built a quick model predicting vertical break on four-seam fastballs across the league. The inputs were release speed and spin axis and those two variables alone explained 28.8% of the variation in vertical break on four-seamers across the majors (adding in spin rate only increased the model’s effectiveness by about three percentage points, since velocity and spin rate are so intertwined). Greinke’s average vertical movement is within 0.7 inches of what you would expect when you plug his pitch characteristics into the model. Thus, the fact that he can produce solid ride at 89 mph is a testament to the efficacy in how he releases and spins the ball.
If the shape of the pitch is not the issue, naturally we turn to the velocity. Right-handed pitchers in the majors are averaging 94 mph on their fastballs; Greinke is down at 89 mph. Among qualified pitchers who throw a four-seamer, Greinke’s velocity is third lowest behind Ryan Yarbrough (86.9 mph) and Kyle Hendricks (87.5 mph). Back in his flame-throwing, Cy Young-winning days, Greinke was sitting around 94 mph at a time when the average big league four-seamer sat 92 mph. But time comes for us all, even professional athletes. In my prior research about Jacob deGrom’s fastball velocity increase at the end of last season, I found pitcher velocity falls off precipitously after their mid-20 and as they age into their 30s.

Year-over-year you would expect a pitcher of Greinke’s age to lose about 0.6 ticks off his fastball and be somewhere around 4 mph less than his peak velocity. This season he is about 5 mph off from his peak around 2008-10:
| Season | Velo (mph) | Z-Move (in) | Zone% | SwStr% |
|---|---|---|---|---|
| 2015 | 92.4 | 18.7 | 50.4 | 9.1 |
| 2016 | 91.9 | 20.0 | 54.9 | 5.2 |
| 2017 | 90.8 | 17.7 | 52.2 | 5.3 |
| 2018 | 89.5 | 17.3 | 51.6 | 5.5 |
| 2019 | 89.9 | 16.5 | 54.6 | 7.0 |
| 2020 | 88.1 | 17.4 | 52.3 | 4.4 |
| 2021 | 88.9 | 16.3 | 58.9 | 5.1 |
Greinke’s insistence on pounding the strike zone with his four-seam fastball stands out this season. The combination of throwing the pitch frequently at lower velocities (relative to the league), often in the zone, and without many swinging strikes would leave one to believe that Greinke is allowing a lot of balls in play and that the fastball is the main problem in Greinke’s subpar strikeout rate. This seems to be the case:
| Season | SwStr% | CS% | BBE% | wOBA |
|---|---|---|---|---|
| 2015 | 12.9 | 16.1 | 18.5 | .232 |
| 2016 | 11.1 | 16.0 | 19.7 | .322 |
| 2017 | 13.4 | 18.3 | 17.1 | .291 |
| 2018 | 11.7 | 19.5 | 18.4 | .290 |
| 2019 | 11.2 | 18.5 | 18.9 | .271 |
| 2020 | 11.3 | 21.4 | 18.5 | .298 |
| 2021 | 10.6 | 17.7 | 20.5 | .299 |
His overall swinging strike rate has decreased considerably. The four-seamer is the only pitch where he has seen this marked decline in whiffs. Greinke’s called strike rate has also sunk despite living in the zone more often this year, a function of batters swinging more and putting the ball in play.
The increase in balls in play is a product of having a more hittable fastball that Greinke is throwing inside the strike zone with increasing frequency. His walk rate is still among the best for qualified starters, but it has increased this season. While still displaying great control (as evidenced by his ability to spot the ball in the zone consistently), Greinke’s command has slipped and been the other driving force behind the loss of strikeouts.
In a previous piece about swing decisions, I introduced my own called strike probability model to evaluate what types of pitches hitters were swinging at most and try to determine which players were the most and least disciplined at the plate. Using this type of model can also be leveraged to evaluate pitchers. The pitches that are most and least likely to be called strikes do not give much insight into command. These pitches give hitters an obvious choice on whether they should swing. The pitchers with the best command, therefore, rely on pitches that make it difficult to gauge whether they will be strikes, borderline pitches if you will. For this analysis, I regard pitches outside the top and bottom decile in terms of called strike probability as the “obvious” pitches and the rest “borderline” pitches. This season marks Greinke’s worst since 2015 in terms of the percentage of his pitches that are borderline by my definition:
| Season | Borderline% |
|---|---|
| 2015 | 25.6 |
| 2016 | 26.1 |
| 2017 | 26.2 |
| 2018 | 27.5 |
| 2019 | 26.0 |
| 2020 | 27.0 |
| 2021 | 24.1 |
Greinke is making it easier than ever for hitters to pull the trigger on swings. Worse yet, he is throwing pitches middle-middle more than ever, a location where the swing decision is relatively trivial for the hitter and, if he does swing, a location where the hitter can do a lot of damage. Of these middle-middle pitches, 52.7% are four-seamers:
| Season | Middle-Middle% |
|---|---|
| 2015 | 6.1 |
| 2016 | 5.5 |
| 2017 | 5.7 |
| 2018 | 5.8 |
| 2019 | 6.0 |
| 2020 | 6.4 |
| 2021 | 6.8 |
The ERA estimators paint a grim picture. While they indicate Greinke is still a serviceable pitcher, he is more of a back of the rotation type than a front-line starter for a championship-caliber club. The former is nothing to sneeze at, it’s just not vintage Greinke. Greinke’s continued reliance on his diminishing fastball and dip in command are the impetus for this decline. He has lost velocity and is leaving more pitches over the middle of the plate than ever before, especially with the four-seamer. His secondary offerings have still been very effective in inducing whiffs. One suggestion for Greinke would be lean on these pitches more, which could help bolster his strikeout total. If the Astros can communicate the benefits of a pitch mix change, maybe he will be receptive. A return to form from Greinke would certainly fortify the Astros’ status as the clear favorite to come out of the American League.
Carmen is a part-time contributor to FanGraphs. An engineer by education and trade, he spends too much of his free time thinking about baseball.
A fun little fact to consider is that he’s doing this while leading the AL in innings pitched. He’s neck and neck with Chris Bassitt, five years his junior, and a quality start’s worth of innings behind Gerrit Cole, the next AL pitcher on the leaderboard. He could do a lot worse than end his career as a back of the rotation innings eater.
Yep. And with a bunch of up and comers in the rotation, along with an unreliable and often injured bullpen, I wouldn’t be surprised if the Astros went to him and asked, above all else, that he eat innings.
That being said, there’s no reason he can’t tinker with his pitch mix to maximize the strengths he has now and increase the quality of those innings!
given his whole deal, I will be shocked if he doesn’t.