What’s Eating Francisco Lindor?

Normally, I’d write some cutesy introduction to this article, maybe regale you with a fun anecdote from my life or make a bad joke to keep the mood light. Today, there’s no time. Francisco Lindor is hitting poorly this year, and we need to get to the bottom of it.
When stars slump early in the season, it’s often easy to see a culprit. Maybe they’re swinging out of their shoes and running a huge strikeout rate. Maybe they’re victims of bad batted ball luck. Maybe they’re playing hurt. In Lindor’s case, the problem is power. Now 195 plate appearances into the season, he’s hit five doubles and four home runs. Those are both by far the worst rates of his career, and combined with a .216 BABIP, they’ve resulted in a desultory batting line.
Easy, right? Lindor stopped hitting the ball hard, so now he’s bad. Only, he’s not:
| Year | Hard-Hit% | Avg. EV | Max EV | Barrel% |
|---|---|---|---|---|
| 2015 | 36.7% | 89.9 | 110.4 | 3.5% |
| 2016 | 33.9% | 88.7 | 112.1 | 4.1% |
| 2017 | 35.9% | 89 | 111.7 | 7.1% |
| 2018 | 40.8% | 90.6 | 114.5 | 9.5% |
| 2019 | 41.0% | 91 | 113.5 | 7.5% |
| 2020 | 41.1% | 89.9 | 111.4 | 5.6% |
| 2021 | 41.4% | 89.6 | 112 | 5.0% |
So much for the lazy analysis — and to be clear, using average exit velocity is absolutely lazy. Whatever’s going wrong, it’s more complicated than a simple power outage.
Keep those statistics in mind, because we’ll be coming back to them. For now, let’s talk about how Lindor got to his power when he was at his best. He’s not a strapping presence, particularly in the context of modern shortstops. He stands 5-foot-11 and seems to generate power out of thin air, not through sheer physical might.
One way to get that power is to swing at pitches where you can best do damage, over the heart of the plate. Batters put up gaudy numbers when they swing at pitches over the heart, and Lindor is no exception. Well, until this year at least. Here are some relevant batted ball numbers for heart-of-the-plate swings over his career:
| Year | Swing% | Swing Runs | Barrel% | wOBACON | xwOBACON |
|---|---|---|---|---|---|
| 2015 | 81% | 5 | 5.4% | 0.44 | 0.404 |
| 2016 | 76% | -4 | 7.3% | 0.39 | 0.408 |
| 2017 | 71% | 12 | 11.3% | 0.434 | 0.457 |
| 2018 | 72% | 15 | 13.1% | 0.453 | 0.455 |
| 2019 | 78% | 6 | 12.7% | 0.434 | 0.441 |
| 2020 | 79% | 0 | 6.7% | 0.413 | 0.424 |
| 2021 | 75% | -6 | 7.4% | 0.333 | 0.383 |
As ugly as that looks, it could have been worse. He’s crushed a double and a homer in his last two games, both on middle-middle pitches.
While those numbers show that Lindor isn’t the same power threat that he was from 2017-19, they can’t explain why he’s been so punchless so far this year. After all, from a barrel rate perspective, he’s doing better in 2021 than he was last season. Barrels are the single best batted ball category, and also the most analytically useful. Here, they’re telling a different tale than his overall numbers.
Another problem vexing Lindor this year: a complete lack of line drives, as Neil Greenberg of the Washington Post noted. In fact, simply swapping in Lindor’s groundball, line drive, and fly ball rates from this year with his previous career production on each batted ball type, we’d expect to see a meaningful decline in production. Those extra grounders replacing line drives “cost” him 20 points of wOBA, a sizable decrease. But uh, he’s seen a 55-point decline this year. Hitting the ball into the ground hurts, but it doesn’t hurt this much.
The last piece of the puzzle is, naturally enough, fly balls. Those aren’t an optimal outcome at the plate — you’d prefer to do nothing but smash line drives — but enough of them turn into doubles or home runs that they’re far preferable for grounders. Or, well, that’s the theory. This year, Lindor’s fly ball production has been downright grounder-esque; his fly balls have gone for a .226 wOBA, hardly distinguishable from the league’s .215 mark on grounders.
What’s wrong here? It’s a problem on both ends of the distribution. First, Lindor has done terribly when he doesn’t get all of the ball. He’s hit 33 fly balls below 95 mph, the cutoff Statcast uses to define whether a ball was hit hard. He has precisely one single to show for them, a weakly-hit fly ball that found a hole in center field:
There’s no real talent to that hit. Sometimes, the ball just lands where there aren’t any defenders. But Lindor is accomplishing that trick at a vanishingly low rate this year, and those empty-calorie singles do a great job propping up a batting line. In this case, I think it’s fair to say that Lindor is getting a little bit unlucky — the league is hitting .082 on weakly-hit fly balls, while he’s batting .030. That’s just two singles, though; not nearly enough to explain his rough year.
Not only that, but Lindor is popping the ball up at a career-high rate — though to be fair, his career high matches the league average rate. He’s gone from a hitter who never pops up to simply average in that category. A previous version of Lindor might sneak out another single or two through fewer wasted pop outs, but again, this isn’t enough to explain what’s wrong.
No, to figure out why Lindor’s fly balls, and also overall production, have dipped, we’ll have to come full circle and examine what happens when he hits the ball well. Remember, Lindor’s hard-hit rate is roughly unchanged this year while his barrel rate is down slightly. But not all barrels are created equal. As Alex Chamberlain explained this January, dividing barrels into two categories — “blasts” and “weak barrels” — gives us further insight into contact quality.
Lindor’s blast rate (I know, I know, so many rates) has declined in tandem with everything else. Not only that, but it’s leading the way. There are roughly as many blasts as weak barrels across the league, but Lindor’s diminished barrel rate is overstating his production; he’s been getting to true premium batted ball outcomes less frequently than ever, even when he barrels the ball up:
| Year | Blast% | Barrel% | Blasts per Weak Barrel |
|---|---|---|---|
| 2015 | 0.9% | 3.5% | 0.35 |
| 2016 | 1.3% | 4.1% | 0.46 |
| 2017 | 2.7% | 7.1% | 0.61 |
| 2018 | 4.3% | 9.5% | 0.83 |
| 2019 | 3.2% | 7.5% | 0.74 |
| 2020 | 2.5% | 5.6% | 0.81 |
| 2021 | 1.4% | 5.0% | 0.39 |
Lindor’s struggles can’t be traced to one central category. He’s getting overwhelmed in the heart of the plate, an area where he used to feast. He’s hitting too many grounders, more pop ups than ever, and not enough line drives. He’s barreling the ball up less often, and even when he does, he’s not blasting the ball the way he used to.
I’ll level with you; I can’t figure out why this is all happening at once. Players don’t generally slump this way, via an aggregation of slight underperformance across a broad spectrum of categories. It can’t really be explained by struggles with a particular pitch; though he’s been particularly poor against cutters this year, pitchers are only throwing them 5.4% of the time, and he’s hit sliders, which are often cross-categorizes with cutters, quite well.
Maybe the answer is that Lindor is just a little off his game and a little unlucky at the same time. He’s just not hitting the ball as well as he normally does, period. He hasn’t slumped when it comes to strikeouts and walks — his swinging strike rate is roughly unchanged, and he’s making his customary high amount of contact while walking at a career-high rate.
The dirty little secret about Lindor, if you can call it that, is that even when he was putting up 30-homer seasons, he never did it with overwhelming power. He’s so good at everything non-contact — walking more than average while rarely striking out is really hard — that even slightly above average results on contact produced a star-level line, particularly when combined with his defensive prowess.
Because he puts the ball in play so often — again, average walks and few strikeouts — he gets to his counting stats the same way. When he hit a career-high 38 homers in 2018, he put 560 balls in play, the second-highest total in the majors. Mike Trout bested him by a single home run, but he did so on 351 balls in play. Teammate José Ramírez, a contact-happy hitter himself, turned 504 batted balls into 39 homers. Lindor is a volume hitter, in other words.
Production on contact is far more variable than production on strikeouts and walks. Even more than that, Lindor’s style of production on contact — heavy on balls in play, relatively light on home runs per batted ball — is the noisiest there is. He’s had stretches like this before, though none quite so extended:
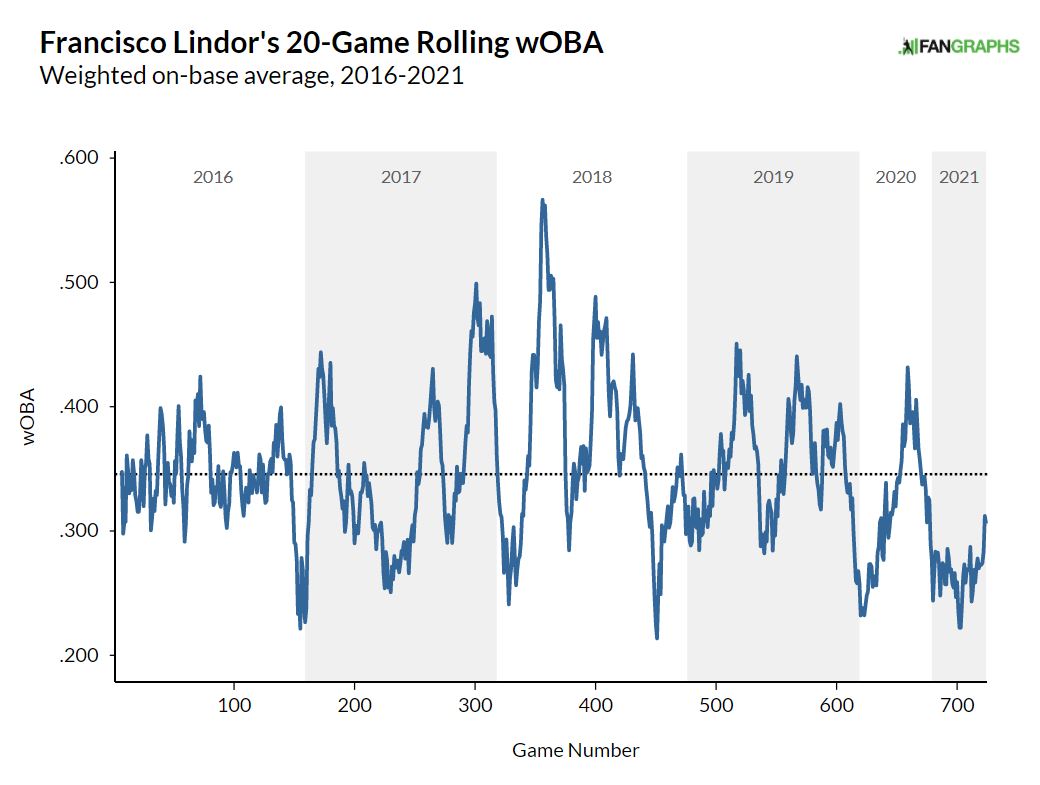
What’s wrong with Francisco Lindor? He’s not hitting the ball well. I’m not all that worried about it yet, though. Lindor’s game is reliant on balls that he hits in the field of play, where a degree or two of launch angle can be the difference between a duck snort single and a running catch.
That’s not to say nothing has changed; those barrel and blast rates really do matter, and a downturn in top-end production makes the normal ebbs and flows of Lindor’s game look worse. But for the most part, Lindor has done what he always does — put a ton of balls in play without overwhelming power — and gotten the short end of the stick. This isn’t a dramatic change in his game, but rather the ugly downside of a volume-based offensive approach combined with a small but real slump in contact quality. That’s small consolation for a ravaged New York roster, but it bodes well for the rest of the season — and the rest of his 10-year contract, to boot.
Ben is a writer at FanGraphs. He can be found on Bluesky @benclemens.
Baseball Savant has a feature that shows histograms of Launch Angle (as well as a few other things). Normally, Lindor has a beautiful normal distribution for LA with low variance centered on 20 to 30 degrees of LA. This season, he’s all over the place with the 20 to 30 LA bucket being 5th-most among batted balls behind -10 to 0, 0 to 10, 10 to 20, and 30 to 40 LA buckets. He’s still swinging the bat hard, but he’s not squaring up with pitches with any kind of control.
Nice addition joe
Great point. I feel like the next important metric for Statcast to add is standard deviation of launch angle. Sweet Spot gets close to this idea, but adding SDLA would help to quickly identify those hitters who aren’t squaring it up.